Chapter 3 The plugins
To provide a better experience to the SWS user, it was developed two plugins to calculate the QI, the so-called standard plugin faoswsQualityIndicators and the flexible one, ´faoswsQITailored´.
The following sessions present both plugins and their specifications.
3.1 faoswsQualityIndicators
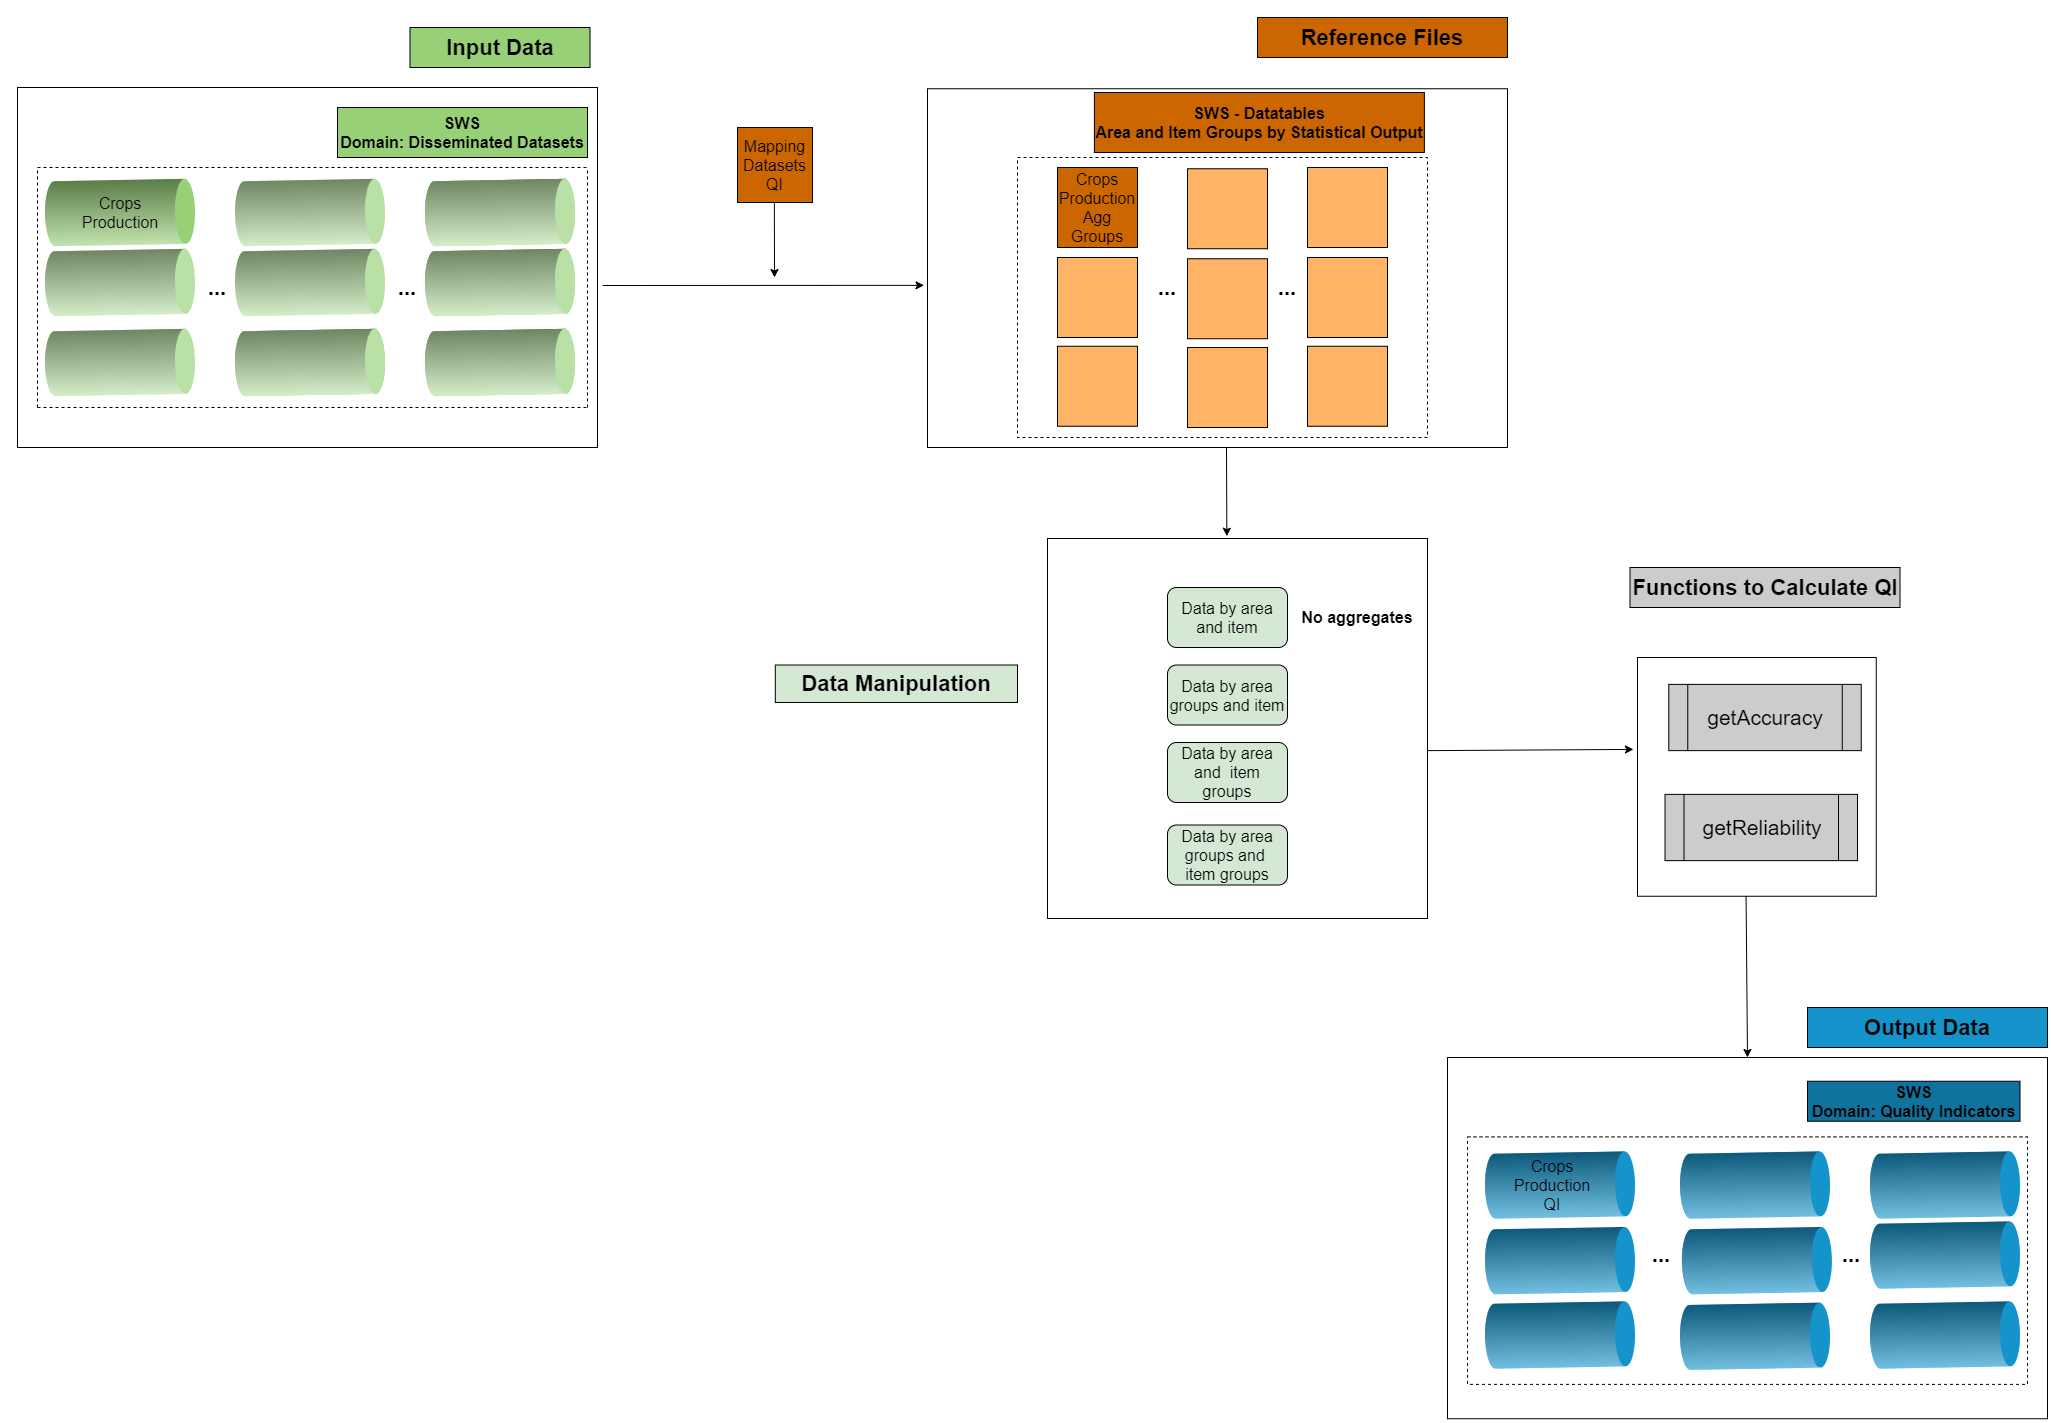
The faoswsQualityIndicators plugin has a well-defined workflow, from input data \(\Rightarrow\) reference files \(\Rightarrow\) data manipulation \(\Rightarrow\) quality indicator computation \(\Rightarrow\) final output.

Figure 3.1: Workflow of the faoswsQualityIndicators module in the SWS for Crops Production
As shown in the above workflow, the input for the QI is the output of a data cycle process (data that goes to dissemination). Thus, after getting the aggregates at area and item level, the QI functions can be applied. Although the process is simple and requires no human intervention, it is important to note that the technical units have to be very careful with the data stored in the domain Disseminated Datasets as they will drive the QI.
3.1.1 Quality Indicators - R functions
There are two functions designed to compute the QI, where each of them is responsible for a quality dimension. This implementation aims to produce indicators for Accuracy and Reliability.
3.1.1.1 getAccuracy
Below you find the workflow of the R function getAccuracy.

Figure 3.2: Workflow of the function getAccuracy
3.1.1.2 getReliability
Below you find the workflow of the R function getReliability.

Figure 3.3: Workflow of the function getReliability
It’s important to highlight that the reliability indicators can be calculated only if there are historical data.
3.1.2 Aggregates
The plugin calculates QI for each element-year at the following levels:
- area and item group;
- area group and item;
- area group and item group.
Thus, the aggregates play a role in the QI. They are the auxiliary data, located in the SWS-Datatables. They are the same aggregates published in the dissemination platform.
Each data set disseminated has got its own table in the SWS-Datatables with its respective aggregate composition of area and item. Therefore, the technical unit must validate these datatables to ensure the plugin is consuming the correct and up-to-date table. You find the list of all datatables with their column description in Datatables.
3.1.3 Running the module
Log in the SWS;
Click on New Query;
Select Quality Indicators and your respective data set. In this example, we choose Crops Production QI;
Select whatever geographicAreaM49, measuredElement, measuredItemCPC and timePointYears. After that, run the query. Otherwise, you can take advantage that the
faoswsQualityIndicatorsis a core plugin (not necessary to create a session to launch it) and just click on the top-right Run plugin.;Figure 3.4: Steps 1 to 4
Select the faoswsQualityIndicators module, choose the parameter (Year) and click on Run plugin;
Figure 3.5: Select the faoswsQualityIndicators plugin and run it
As it is a core plugin, the data will be directly saved in the Database and an email will be sent to the user when it is complete.
3.2 faoswsQITailored
The tailored plugin is the fruit of one of the requests of the several technical units we work with. There was a need to calculate QI at a non-conventional way, grouping the results by year and also element, besides creating new aggregate groups at area and item levels. Therefore, a new plugin was developed. The tailored plugin is a much-needed tool, designed to fill in the user´s needs with regards to the QI.