Chapter 1 Quality Indicators Framework
The Quality Indicators (QI) module is meant to take place right after a statistical process has been validated. This means that a technical unit has already finalized its entire data processing (questionnaire dispatch \(\Rightarrow\) data collection \(\Rightarrow\) data entry \(\Rightarrow\) data cleaning \(\Rightarrow\) imputation \(\Rightarrow\) validation) and it is ready to release the data. Thus, the officer in charge can analyse the quality of the data before disseminating and may return to any step of the process if he/she deems necessary.
The workflow of the QI module is shown below. As mentioned above, it starts when the data is ready to be released. In the SWS context, this means that the technical unit can tag its data set and materialize it in the SWS domain Disseminated Datasets. Therefore, the faoswsQualityIndicators module can compile the indicators and save them in a dedicated dataset in the domain Quality Indicators. In this way, the officer in charge can find the results either in the SWS or in the Shiny App.
It is important to highlight that each technical unit is responsible for its own data in the domain Disseminated Datasets, which means that the technical unit is the only one who is able to populate/modify its own data.
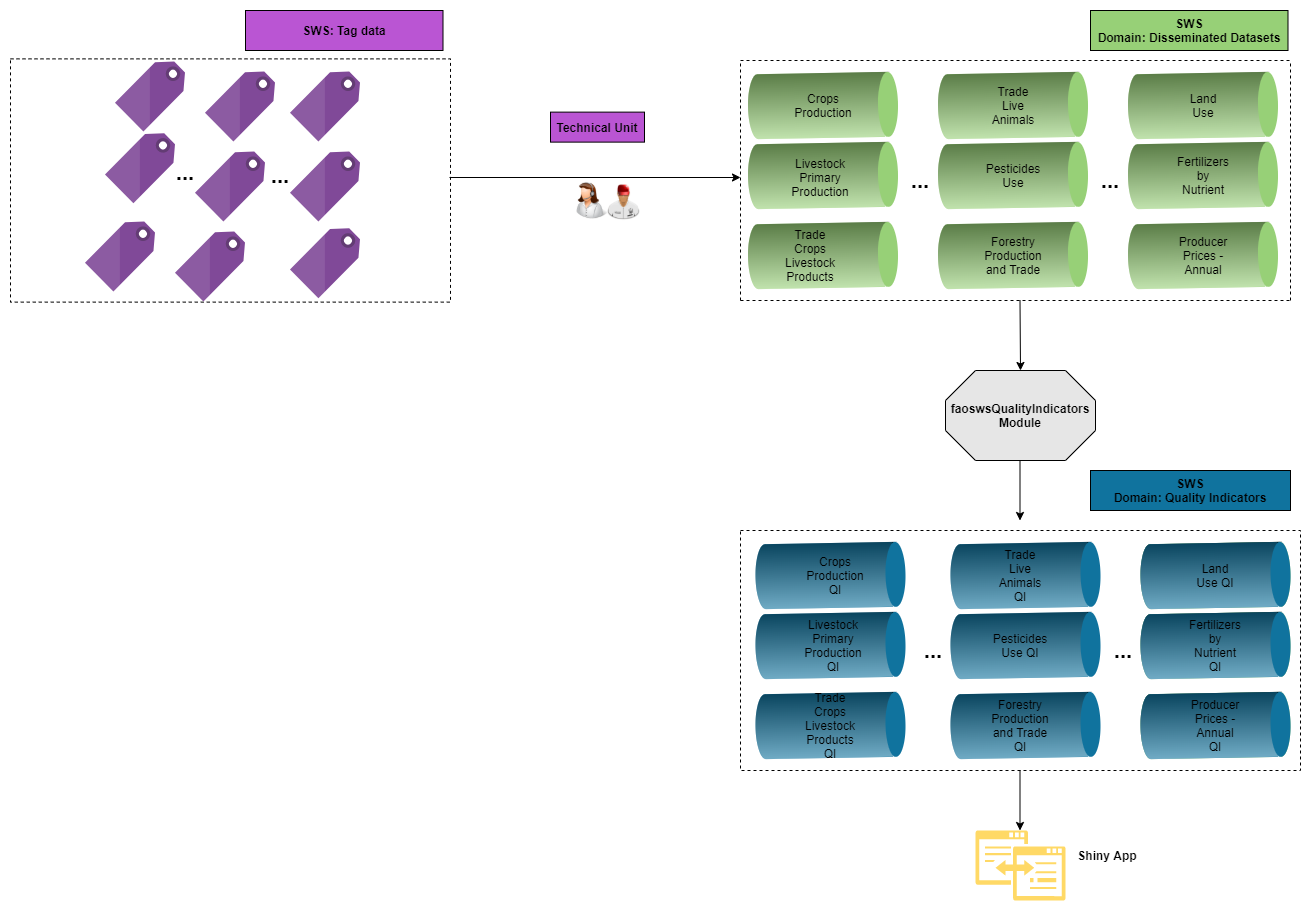
Figure 1.1: Overall Workflow of the Quality Indicators module in the SWS
1.1 Build up historical data disseminated in the SWS
It is known that the SWS was built to be a working system and not a dissemination platform. This means that unless a technical unit creates a dedicated data set to store only the dissemination data, this data will be found only in the dissemination platform because as time passes, the data may be revised or another imputation method tested and not necessarily be disseminated for various reasons. Thus, there might be differences between the data found in the two systems.
Despite this issue, it is still worth to compute the QI for the historical data disseminated. In order to do so, the CSI-SWS team had to retrieve the data from the dissemination platforms (e.g. FAOSTAT) and bring it back to the SWS for the technical units that did not create the data dissemination. This exercise is illustrated in the below figure.
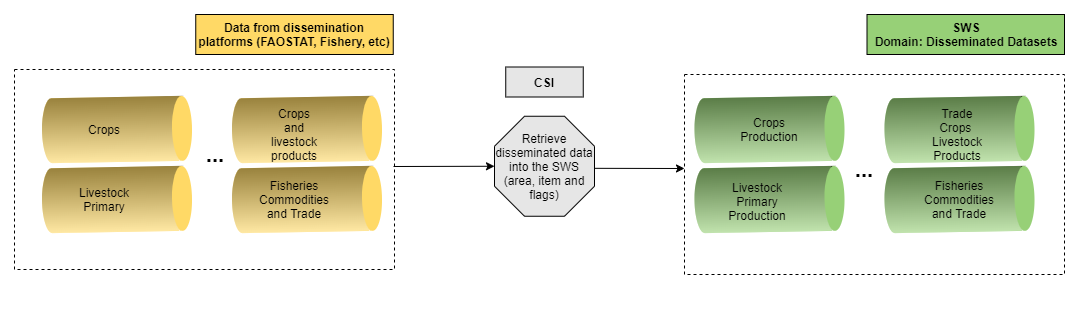
Figure 1.2: Workflow to retrieve historical data disseminated
For each disseminated data to be migrated to SWS there is a need to convert:
- areas to
geographicAreaM49; - items to
measuredItemCPC(or another code list that contains those items); - elements to
measuredElement(or another code list that contains those elements); - flags to SWS flag system (
flagObservationStatusandflagMethod).
Converting areas, items and elements from one system to another one is usually straightforward. However, the flag conversion is possible only from SWS to FAOSTAT. The other way round is not feasible as there is no one-to-one correspondence. Therefore the only way to retrieve the flags is, given a combination country-element-item-year-value disseminated, convert areas, items and elements to the SWS format and searches for it in the SWS - including in the historical data. The two data points should match exactly in terms of values for that year. Thus one can find the SWS flag system. If the values in both systems do not match, the algorithm takes the most recent figure with its flags.
1.2 Statistical Outputs
FAO is responsible for the dissemination of several statistical outputs including data on agriculture production and trade, forestry, fisheries, fertilizers, pesticides, producer prices and others. Along with the data, it is also important for transparency purposes to release information regarding its quality. Thus this book describes in details the process to compile the QI for each of these outputs, as they are composed of differents kinds of elements, items and areas. Moreover, each statistical process may have its own data processing, from harvesting to storage, with peculiarities that need to be taken into consideration when calculating the QI.
1.2.1 Crops
Crops are disseminated in FAOSTAT under Production. In order to calculate their QI, there was a need to build up the historical data disseminated as described in Build up historical data disseminated in the SWS. Its correspondent data set in the SWS is in the domain agriculture, data set aproduction.
1.2.2 Livestock Primary
Livestock Primary is disseminated in FAOSTAT under Production. In order to calculate their QI, there was a need to build up the historical data disseminated as described in Build up historical data disseminated in the SWS. Its correspondent data set in the SWS is in the domain agriculture, data set aproduction.
1.2.3 Crops and livestock products
Crops and livestock products are disseminated in FAOSTAT under Trade. In order to calculate their QI, there was a need to build up the historical data disseminated as described in Build up historical data disseminated in the SWS. Its correspondent data set in the SWS is in the domain trade, data set total_trade_cpc_m49.
1.2.4 Live animals
Live animals are disseminated in FAOSTAT under Trade. In order to calculate their QI, there was a need to build up the historical data disseminated as described in Build up historical data disseminated in the SWS. Its correspondent data set in the SWS is in the domain trade, data set total_trade_cpc_m49.
1.2.5 Fertilizers by Nutrient
Fertilizers by Nutrient are disseminated in FAOSTAT under Inputs. The Environment Team responsible for this output has already created a dedicated dissemination data set called Fertilizers (dissemination) in the SWS to store the data. Therefore, there was a need to make a copy of it into the domain Disseminated Datasets.
1.2.6 Fertilizers by Product
Fertilizers by Product are disseminated in FAOSTAT under Inputs. The Environment Team responsible for this output has already created a dedicated dissemination data set called Fertilizers (dissemination) in the SWS to store the data. Therefore, there was a need to make a copy of it into the domain Disseminated Datasets.
1.2.7 Forestry Production and Trade
Forestry Production and Trade are disseminated in FAOSTAT under Forestry. In order to calculate their QI, there was a need to build up the historical data disseminated as described in Build up historical data disseminated in the SWS. Its correspondent data set in the SWS is in the domain Forestry, data set forestry_prod_trade_agg_diss.
1.2.8 Aquaculture Production
Aquaculture Production are disseminated through the Windows and Mac application FishStatJ. In the domain Disseminated Datasets, its data set is Aquaculture Production Disseminated.
1.2.9 Capture Production
Capture Production are disseminated through the Windows and Mac application FishStatJ. In the domain Disseminated Datasets, its data set is Capture Production Disseminated.
1.2.10 Producer Prices
Producer Prices are disseminated in FAOSTAT under Prices. The disseminated data set in the domain Disseminated Datasets is Annual Producer Prices (Validation) - Diss.
1.2.11 Pesticides Use
Pesticides Use are disseminated in FAOSTAT under Inputs. The Environment Team responsible for this output has already created a dedicated dissemination data set called Pesticides Use (dissemination) in the SWS to store the data. Therefore, there was a need to make a copy of it into the domain Disseminated Datasets.
1.2.12 Pesticides Trade
Pesticides Trade are disseminated in FAOSTAT under Inputs. The Environment Team responsible for this output has already created a dedicated dissemination data set called Pesticides Trade (dissemination) in the SWS to store the data. Therefore, there was a need to make a copy of it into the domain Disseminated Datasets.
1.2.13 Land Use
Land Use are disseminated in FAOSTAT under Inputs. The Environment Team responsible for this output has already created a dedicated dissemination data set called Land Use (dissemination) in the SWS to store the data. Therefore, there was a need to make a copy of it into the domain Disseminated Datasets.