A SWS resources
SWS resources are R modules, datatables, data sets, and code lists comprising a migration framework. Data tables are typically used as auxiliary data to help R modules to achieve their goals. The statistical domains in SWS, through code/reference lists, define the dimensions of the datasets. Therefore, datasets are primarily used to store code list - referenced values as either input and output in the SWS.
A.1 Code lists
Code lists, also called reference lists in SWS parlance, are the dimensions making up the data sets that are designed by the user to store analytical results from SWS modules. The dimensions are statistical-domain-specific and are defined by the technical unit to reflect its needs regarding data collection, processing, and dissemination while meeting FAO standards. Each data set dimension has a set of codes and their associated descriptions. Thus, code lists serve to the purpose of standardization, visualization, and metadata by associating standardized codes to standardized names in the SWS data set outputs. A typical SWS compliant data set has, therefore, the following dimensions/reference lists:
Geographic area. Representing a spatial scale the information is measured at. For example, countries, territories, regional aggregates, regional special groups aggregates, global aggregates. In SWS, the geographic area dimension used by AQUASTAT data sets is named geographicAreaM49.
Items. Those one wants to take a measurement from. For example, commodities, commodity groups, land use types, species, etc. Typical item dimension names are measuredItemCPC, *measuredItemHS, measuredItem. The AQUASTAT - SWS framework does not include item code/reference list.
Elements. Often representing a measurement that can be taken across different items. For example, area, production, share. In SWS, the element dimension/code list used by AQUASTAT is aquastatElement.
Time (the time unit the data is displayed for: year, months, etc). In SWS, the time dimension used by AQUASTAT data sets is named timePointYears.
Flag (A standardized label indicating origin and/or nature of a number in the data set, e.g.
(Official number)). In SWS, the flag dimension used by AQUASTAT data sets is named flagObservationStatus. Please check the OCS statistical standards and the flags document to understand the flagObservationStatus rational and obtain the description of flags.
| Flag | Description | Annotation |
|---|---|---|
| <blank> | Official figure | Observation reported to FAO by official statistical government agencies. |
| B | Time series break | Break observations are characterized as such whendifferent content exist or a different methodology has beenapplied to this observation as compared with the preceding one (the one given for the previous period). |
| E | Estimated value | Observation obtained through an estimation methodology (e.g. to produce back-casts) or based on the use of a limited amount of data or ad hoc sampling and through additional calculations (e.g. to produce a value at an early stage of the production stage while not all data are available). It may also be used in case of experimental data (e.g. in the context of a pilot ahead of a full scale production process) or in case of data of (anticipated/assessed) low quality. If needed, additional (uncoded) information can be provided through (free text) “comments” at the observation level or at a higher level. |
| F | Forecast value | Value deemed to assess the magnitude which a quantity will assume at some future point of time (as distinct from "“estimated value”" which attempts to assess the magnitude of an already existent quantity). |
| I | Imputed value | Observation imputed by FAO to replace or fill gaps in national data series, in line with the recommendations of the Committee for the Coordination of Statistical Activities (CCSA). |
| O | Missing value | This code is to be used when no distinction is made between the reasons why data are missing. Data can be missing due to various reasons: data do not exist, are insignificant (or not collected because they are below a certain threshold), are unreliable, are not relevant for the period, or other reason not elsewhere specified. |
| M | Missing value (data cannot exist, not applicable) | Used to denote empty cells resulting from the impossibility to collect a statistical value (e.g. a particular education level or type of institution may be not applicable to a given country’s education system). |
| Q | Missing value; suppressed | Used when data are suppressed due to statistical confidentiality considerations. |
| N | Not significant (negligible) | An observation is below the unit precision level. |
| P | Provisional value | An observation is characterized as “provisional” when the source agency –while it bases its calculations on its standard production methodology –considers that the data, almost certainly, are expected to be revised. |
| R | Revised | Revised official figure. |
| S | Exceptional event | Exceptional events such as earthquake, massive forest fire, draught and flooding that occurred in the corresponding period that may have affected the observation or caused a missing value. |
| T | Unofficial figure | Observation reported by non-official or semi-official sources. Includes semi-official figure. Includes data from trade organizations (e.g. International Grain Council, International Sugar Organization etc.). |
| X | Figure from international organizations | Observations, both official and non-official, reported by governmental international organizations (e.g. UN, ILO, WB, UNESCO, Eurostat etc. specification on which international organization is provided in the metadata). |
- Method (A standardized label indicating method utilized to obtain a number in the data set. In SWS, the method dimension used by AQUASTAT data sets is named flagMethod. Please check the OCS statistical standards and the flags document to understand the flagMethod rational and obtain the description of flags.
| Flag | Description |
|---|---|
|
|
Unknown collection method |
| b | Balancing item |
| c | Copied from elsewhere in the working system |
| e | Estimate automatically generated by a statistical algorithm (short: statistical estimate) |
| f | Estimate manually derived, also on the basis of expert judgement (short: manual estimate) |
| h | Collected using automatic data harvesting |
| i | Calculated as identity (e.g. yield) |
| n | Value not collected or estimated, but can be assumed to be negligible |
| p | Collected (manually) from publications or databases |
| q | Collected via a questionnaire (e.g. APQ) |
| s | Calculated as sum (e.g. Grand Total, or High-income countries) |
| t | Carry-forward estimate |
| u | Value not known |
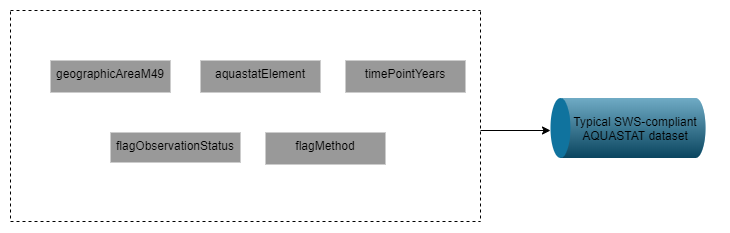
Figure A.1: Typical dimensions (SWS code/reference lists) composing a AQUASTAT SWS - compliant input/output dataset
A.2 Datatables
Datatables are mainly used to store information helping R modules to output analytical results. Information in datatables can be of a number of types. For example, conversion factors, arithmetic formulas, mapping between flags, mapping between international classifications, etc. In SWS hierarchy. all datatables reside in a given statistical domain. Variable names (aka column names) in SWS datatables are more flexible in terms of the names they can take than SWS datasets. One can find SWS datatables naming variables as element_code, element_code_sws, element_code_faostat, etc. Likewise, columns describing countries across different datatable may have different classification systems. This flexibility in datatables is beneficial as it allows to accommodate different auxiliary information. In the AQUASTAT - SWS migration framework, the data tables are in the Aquastat domain. Below is a list of current available and filled data tables in the Aquastat domain.
AQUASTAT Reference
- Datatable:
aquastat_reference - Domain: AQUASTAT
- Usage: This is a reference table listing AQUASTAT element codes, names, dissemination status, variable/indicator status, sources, long-term average variable status and the primary variable rule status.
| Field | Description |
|---|---|
| element_code | AQUASTAT element code |
| element_name | AQUASTAT element name |
| disseminated | Flag of disseminated (D = disseminated , I = internal) |
| calculated | Flag of calculated |
| source | Source of the element (e.g. FAOSTAT, AQUASTAT, ILO) |
| lta | Flag of Long Term Average ( 1 = TRUE, 0 = FALSE) |
| pr | Flag of Primary Variable (1 = TRUE, 0 = FALSE) |
AQUASTAT Sources
- Datatable:
aquastat_sources - Domain: AQUASTAT
- Usage: This datatable stores AQUASTAT data source references.
| Field | Description |
|---|---|
| Source_Id | ID source |
| Title | Title of the ID source |
| Personal_Author | Name of author |
| Corporate_Author | Name of corporate author |
| Journal_Title | Name of journal |
| Publication_Year | Year of publication |
| Editor | Name of editor |
| Comments | Comments about the publication |
| Hidden | Flag of hidden |
| area_id | FAOSTAT Area code |
| Area_name | FAOSTAT Area name |
| source_file | Source of the file |
| source_url | URL of the source |
| Source_type | Type of source |
Calculation Rule
- Datatable:
calculation_rule - Domain: AQUASTAT
- Usage: This datatable stores the pre-defined calculation rules used to obtain AQUASTAT indicators/derived variables. This table is used by the faoswsAquastatUpdate module.
| Field | Description |
|---|---|
| calculation_rule | The formula for the indicator |
| indicator_code | The indicator code |
| primary_variable | The primary variable, if any |
| indicator_unit | Unit of the indicator |
| indicator_name | Name of the indicator |
| component_code | Components code |
| component_name | Name of the components |
| order_calc | Order of the calculation |
Global Dam Reservoir
- Datatable:
global_dam_reservoir - Domain: AQUASTAT
- Usage: A datatable storing information on the major Dams at the country level and used to calculate Dam capacity time-series.
| Field | Description |
|---|---|
| id | ID of the dam |
| Country | Name of country |
| Name of Dam | Name of dam |
| Alternate Dam Name | Unit of the indicator |
| ISO alpha-3 | Country name (ISO) |
| Region | Region of country |
| Administrative Unit | Administrative region within the country |
| Nearest city | Name of the city nearest to where the dam is located |
| River | River on which the dam is built |
| Major basin | Name of the major river basin in which the dam is located |
| Sub-basin | Name of the sub-basin in which the dam is located |
| Completed/operational since | Year in which the dam was completed, operational or improved |
| Dam height(m) | Height of dam in metres. The precision given is two decimals (cm), although most of the available figures are given with a precision of 1 metre |
| Reservoir capacity (million m3) | Capacity of reservoir in million (1 000 000) cubic metres (this is equivalent to hm3). It refers to the initial capacity, not taking into consideration the reduction in volume due to sedimentation |
| Dam Category | |
| Reservoir area (km2) | Surface area of the reservoir in square kilometres |
| Yearly ETO (mm/m) | |
| Evaporation | Dam evaporation |
| Evaporation/Capacity | Average evaporation per capacity area |
| Sedimentation (latest known) (%) | Percentage of initial capacity lost to sedimentation (%). This information is updated to be latest known. |
| Irrigation | An "“x”" here denotes the dam is used for this purpose. Check the comment for potential additional details. |
| Water supply | An "“x”" here denotes the dam is used for this purpose. Check the comment for potential additional details. |
| Flood control | An "“x”" here denotes the dam is used for this purpose. Check the comment for potential additional details. |
| Hydroelectricity MIW | An "“x”" here denotes the dam is used for this purpose. Check the comment for potential additional details. |
| Navigation | An "“x”" here denotes the dam is used for this purpose. Check the comment for potential additional details. |
| Recreation | An "“x”" here denotes the dam is used for this purpose. Check the comment for potential additional details. |
| Pollution control | An "“x”" here denotes the dam is used for this purpose. Check the comment for potential additional details. |
| Livestock rearing | An "“x”" here denotes the dam is used for this purpose. Check the comment for potential additional details. |
| Other | Purpose of the dam other than the 8 above. Check the comment for potential additional details. |
| Decimal degree latitude | Latitudinal coordinate of the dam, expressed in decimal degrees. |
| Decimal degree longitude | Longitudinal coordinate of the dam, expressed in decimal degrees. |
| Validated | |
| National reference(s) | Number of reference providing information on the dam, coming from a national source. The references are given in Notes and References of the regional file. |
| Other reference(s) | Number of reference providing information on the dam, coming from a global or general source (for example ICOLD). The references are given in Notes and References of the regional file |
| Internal metadata | |
| GEO NOTES | |
| Comments | In this column specific comments of importance to the dam are given |
Global Map of Irrigated Area
- Datatable:
Global Map of Irrigated Area - Domain: AQUASTAT
- Usage: A datatable storing information for the update of spatial representation of irrigated areas at the national level.
| Field | Description |
|---|---|
| id | |
| Country | Name of country |
| Admin1 | Name of Admin1 |
| Admin2 | Name of Admin2 |
| Admin3 | Name of Admin3 |
| Area(ha) | Area in ha |
| Year | Year to which the irrigated areas (following field) refers to |
| Flag_src | Water source for irrigation |
| AEI(ha) | Area equipped for irrigation in hectare |
| AEI_GW(ha) | Area equipped for irrigation by groundwater in hectare |
| AEI_SW(ha) | Area equipped for irrigation by surface water in hectare |
| AEI_NC(ha) | Area equipped for irrigation by non-conventional water in hectare |
| AAI(ha) | Area equipped for irrigation actually irrigated in hectare |
| AAI_GW(ha) | Area equipped for irrigation by groundwater actually irrigated in hectare |
| AAI_SW(ha) | Area equipped for irrigation by surface water actually irrigated in hectare |
| AAI_NC(ha) | Area equipped for irrigation by non-conventional water actually irrigated in hectare |
| AEI_MIRCA(ha) | Area equipped for irrigation in hectare from MIRCA 2000 - Global data set of monthly irrigated and rainfed crop areas around the year 2000 |
| AHI_MIRCA(ha) | Harvested irrigated crop area in hectare from MIRCA 2000 - Global data set of monthly irrigated and rainfed crop areas around the year 2000 |
| MMGA_MIRCA(ha) | |
| ICWU_GCWM(m3 yr-1) | |
| cs1 | |
| cs1*MMGA_MIRCA | |
| cs2 | |
| ICWU(m3 yr-1) | Irrigation consumptive water use |
| ICWU_GW(m3 yr-1) | Irrigation consumptive groundwater use |
| ICWU_SW(m3 yr-1) | Irrigation consumptive surface water use |
| ICWU_NC(m3 yr-1) | Irrigation consumptive non-conventional water use |
| AEI_GW_PCT | Pourcentage of area equipped for irrigation by groundwater |
| AEI_GW_FRAC | Fraction of the area equipped for irrigation by groundwater |
| AEI_SW_PCT | Pourcentage of area equipped for irrigation by surface water |
| AEI_SW_FRAC | Fraction of the area equipped for irrigation by surface water |
AQUASTAT SDG Aggregates
- Datatable:
aqua_sdg_agg - Domain: AQUASTAT
- Usage: A datatable storing the calculation rules to apply to aggregation of the SDG 6.4.2 (Water Stress) at the regional level and used by the faoswsAquastatAggregation.
| Field | Description |
|---|---|
| region_el_code | Element code for the SDG region |
| relevant_el_code | Relevant element code |
| country_el_code | Country code |
| addition | Formula |
| sdg_region | Code of SDG region |
| group_order_name | Name of the group |
| column_to_select | |
| transboundary | |
| indicator | Element code of the indicator |
AQUASTAT External sources
- Datatable:
aqua_external_source - Domain: AQUASTAT
- Usage: A data table with the mapping between AQUASTAT and data used by AQUASTAT from external agencies and used by the faoswsAquastatExternal module.
| Field | Description |
|---|---|
| element_code | Element code |
| element_name | Element name |
| source | Source |
| source_item_code | Item code in the Source |
| source_element_code | Element code in the Source |
| data_link | Link of the data |
M49 FS ISO Mapping
- Datatable:
m49_fs_iso_mapping - Domain: Common Domain
- Usage: A datatable with the correspondence between FAOSTAT, UNSDM49, ISO3, and ISO3 codes. This table is used by the faoswsAquastatExternal module.
| Field | Description |
|---|---|
| group_area_code | FAOSTAT group area code |
| group_area_name | Group area name |
| fs_area_code | FAOSTAT area code |
| fs_area_name | FAOSTAT area name |
| m49 | M49 area code |
| iso2 | ISO two-letter country code |
| iso3 | ISO three-letetr country code |
A.3 Datasets
Datasets in the SWS are interchangeably used as module inputs/outputs and are composed by dimensions (aka reference/code lists). Because SWS datasets contain code lists following international standards as dimensions, there is little space for variation of dimension names across SWS datasets for the sake of standardization. In the AQUASTAT - SWS framework, the available data sets are:
aquastat_legacy. The aquastat_legacy is an SWS dataset with the legacy data from the ‘Old’ AQUASTAT working system. The CSI - SWS has migrated the aquastat_legacy dataset into the SWS in order to store the whole data coming from the old system. The aquastat_legacy dataset is the bare minimum of AQUASTAT, meaning that none analytical process has been applied to it, including the calculation of AQUASTAT indicators (aka derived variables).
aquastat_questionnaire. An SWS dataset fed with new data (though import) to be incorporated in the AQUASTAT database. This dataset feeds, along with the aquastat_external and the aquastat_legacy_ltacorrected datasets, the
faoswsAquastatUpdatemodule. More information is found in the chapter 2.aquastat_external. An SWS dataset output from the faoswsAquastatExternal module which replaces the lack of a proper CSI-developed harvester for external source data used by AQUASTAT. More information is found in the chapter 3.
aquastat_update. This dataset is the most complete and updated one, storing the AQUASTAT compiled calculated and imputed data. For more details, please see chapter 4.
aquastat_legacy_2flags. This is a copy of the Aquastat_legacy dataset where the flags of the old AQUASTAT working system have been converted to the SWS flags using the following mapping.
aquastat_legacy_ltacorrected. This is a copy of the Aquastat_legacy_2flags dataset where the Long Term Averages (LTA) variables, mostly corresponding to water resources variables, have been uploaded for each year (vs once every 5 year in the old working system) and corrected when needed. Indeed the migration from the old working system to the SWS for these LTA created some differences in the dataset. It’s also one of the inputs for the module faoswsAquastatUpdate.