Chapter 4 The faoswsAquastaUpdate module
The faoswsAquastatUpdate module is the heart of the AQUASTAT migration into the SWS since it runs the periodic update of the aquastat_update dataset whenever new data from questionnaire and/or external sources are available.
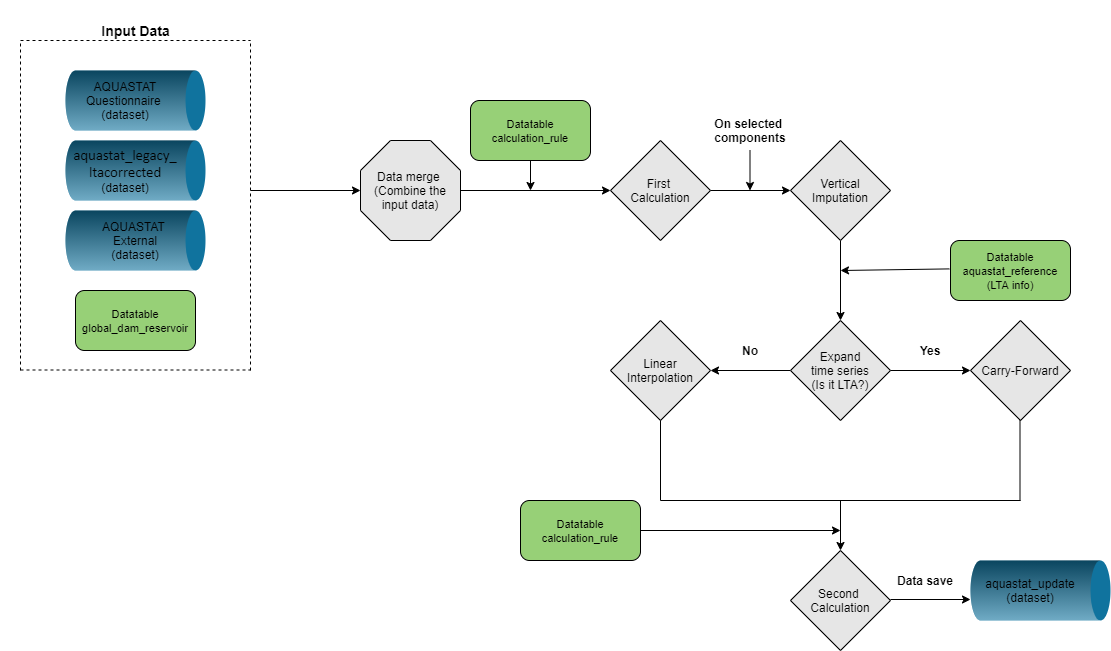
Figure 4.1: Workflow of the faoswsAquastatUpdate module
4.1 Methods
The faoswsAquastatUpdate module applies different imputation’s methods, depending on the aquastatElement. Below you find their definitions and applications in the module.
4.1.1 Calculate indicators (First Calculation)
After merging the data coming from the AQUASTAT Questionnaire, AQUASTAT External and aquastat_legacy_ltacorrected, the faoswsAquastatupdate module implements the calculation of indicators by applying the information in the SWS calculation_rule datatable.
| calculation_rule | indicator_name | component_name |
|---|---|---|
| [4100]=[4559]+[4560] | [Total area of the country (excl. coastal water)] | [Land area]+[InlandWater] |
| [4107]=[4104]/([4100]/100) | [Population density] | [Total population]/([Total area of the country]/100 |
| [4108]=[4109]+[4110] | [Population economically active in agriculture] | [Male population economically active in agriculture]+[Female population economically active in agriculture] |
| [4150]=[4100] * [4151] / 100000 | [Long-term average annual precipitation in volume] | [Total area of the country]*[Long-term average annual precipitation in depth]/100000 |
| [4157]=[4154]+[4155]-[4156] | [Total internal renewable water resources (IRWR)] | [Groundwater produced internally]+[Surface water produced internally]-[Overlap between surface water and groundwater] |
| [4158]=[4157]*1000000/[4104] | [Total internal renewable water resources per capita] | [Total internal renewable water resources (IRWR)]*1000000/[Total population] |
| [4164]=[4160]+[4162]+[4168] | [Surface water: accounted inflow] | [Surface water: inflow not submitted to treaties]+[Surface water: inflow secured through treaties]+[Surface water: accounted flow of border rivers] |
| [4176]=[4160]+[4162]+[4168]-[4174] | [Surface water: total external renewable] | [Surface water: inflow not submitted to treaties]+[Surface water: inflow secured through treaties]+[Surface water: accounted flow of border rivers]-[Surface water: outflow to other countries secured through treaties] |
| [4182]=[4176]+[4452] | [Water resources: total external renewable] | [Surface water: total external renewable]+[Groundwater: accounted inflow] |
| [4185]=[4176]+[4155] | [Total renewable surface water] | [Surface water: total external renewable]+[Surface water produced internally] |
| [4187]=[4154]+[4452] | [Total renewable groundwater] | [Groundwater produced internally]+[Groundwater: accounted inflow] |
| [4188]=[4185]+[4187]-[4156] | [Total renewable water resources] | [Total renewable surface water]+[Total renewable groundwater]-[Overlap between surface water and groundwater] |
| [4190]=[4188]*1000000/[4104] | [Total renewable water resources per capita] | [Total renewable water resources]*1000000/[Total population] |
| [4192]=100*([4164]+[4452])/([4164]+[4452]+[4157]) | [Dependency ratio] | 100*([Surface water: accounted inflow]+[Groundwater: accounted inflow])/([Surface water: accounted inflow]+[Groundwater: accounted inflow]+[Total internal renewable water resources (IRWR)] |
| [4509]=[4193]+[4194] | [Exploitable: total renewable surface water] | [Exploitable: regular renewable surface water]+[Exploitable: irregular renewable surface water] |
| [4196]=[4509]+[4195] | [Total exploitable water resources] | [Exploitable: total renewable surface water]+[Exploitable: regular renewable groundwater] |
| [4253]=[4251]+[4252]+[4250] | [Total water withdrawal] | [Municipal water withdrawal]+[Industrial water withdrawal]+[Agricultural water withdrawal] |
| [4254]=[4250]/[4253]*100 | [Agricultural water withdrawal as % of total water withdrawal] | [Agricultural water withdrawal]/[Total water withdrawal]*100 |
| [4255]=[4251]/[4253]*100 | [Municipal water withdrawal as % of total water withdrawal] | [Municipal water withdrawal]/[Total water withdrawal]*100 |
| [4256]=[4252]/[4253]*100 | [Industrial water withdrawal as % of total water withdrawal] | [Industrial water withdrawal]/[Total water withdrawal]*100 |
| [4257]=[4253]*1000000/[4104] | [Total water withdrawal per capita] | [Total water withdrawal]*1000000/[Total population] |
| [4263]=[4261]+[4262] | [Total freshwater withdrawal] | [Total water withdrawal]-[Desalinated water produced]-[Direct use of treated municipal wastewater]-[Direct use of agricultural drainage water] |
| [4263]=[4253]-[4264]-[4265]-[4451] | [Total freshwater withdrawal] | [Total water withdrawal]-[Desalinated water produced]-[Direct use of treated municipal wastewater]-[Direct use of agricultural drainage water] |
| [4271]=100*[4260]/[4250] | [Agricultural water requirement as % of agricultural water withdrawal] | 100*[Irrigation water requirement]/[Agricultural water withdrawal] |
| [4273]=100*[4250]/[4188] | [Agricultural water withdrawal as % of total renewable water resources] | 100*[Agricultural water withdrawal]/[Total renewable water resources] |
| [4275]=100*[4263]/[4188] | [MDG 7.5. Freshwater withdrawal as % of total renewable water resources] | 100*[Total freshwater withdrawal (primary and secondary)]/[Total renewable water resources] |
| [4300]=[4303]+[4304] | [Total cultivated area drained] | [Area equipped for irrigation drained]+[Non-irrigated cultivated area drained] |
| [4305]=100*[4300]/[4103] | [% of total cultivated area drained] | 100*[Total cultivated area drained]/[Cultivated area (arable land + permanent crops)] |
| [4311]=[4308]+[4309]+[4310] | [Area equipped for full control irrigation: total] | [Area equipped for full control irrigation: surface irrigation]+[Area equipped for full control irrigation: sprinkler irrigation]+[Area equipped for full control irrigation: localized irrigation] |
| [4313]= [4311]+[4312]+[4316] | [Area equipped for irrigation: total] | [Area equipped for full control irrigation: total]+[Area equipped for irrigation: equipped lowland areas]+[Area equipped for irrigation: spate irrigation] |
| [4550]=100*[4263]/([4188]) | [SDG 6.4.2. Water Stress] | 100*[Total freshwater withdrawal (primary and secondary)]/([Total renewable water resources] |
| [4317]= [4313]+[4314]+[4315] | [Total agricultural water managed area] | [Area equipped for irrigation: total]+[Flood recession cropping area non-equipped]+[Cultivated wetlands and inland valley bottoms non-equipped] |
| [4319]=100*[4313]/[4317] | [% of agricultural water managed area equipped for irrigation] | 100*[Area equipped for irrigation: total]/[Total agricultural water managed area] |
| [4323]=100*[4320]/[4313] | [% of area equipped for irrigation by groundwater ] | 100*[Area equipped for irrigation by groundwater]/[Area equipped for irrigation: total] |
| [4324]=100*[4321]/[4313] | [% of area equipped for irrigation by surface water] | 100*[Area equipped for irrigation by surface water]/[Area equipped for irrigation: total] |
| [4325]=100*[4322]/[4313] | [% of area equipped for irrigation by mixed surface water and groundwater] | 100*[Area equipped for irrigation by mixed surface water and groundwater]/[Area equipped for irrigation: total] |
| [4327]=100*[4326]/[4313] | [% of area equipped for irrigation power irrigated] | 100*[Area equipped for power irrigation (surface water or groundwater)]/[Area equipped for irrigation: total] |
| [4328]=100*[4318]/[4313] | [% of the area equipped for irrigation actually irrigated] | 100*[Area equipped for irrigation: actually irrigated]/[Area equipped for irrigation: total] |
| [4330]=100*[4313]/[4307] | [% of irrigation potential equipped for irrigation] | 100*[Area equipped for irrigation: total]/[Irrigation potential] |
| [4331]=100*[4313]/[4103] | [% of the cultivated area equipped for irrigation] | 100*[Area equipped for irrigation: total]/[Cultivated area (arable land + permanent crops)] |
| [4445]=100*[4400]/[4313] | [% of area equipped for irrigation salinized] | 100*[Area salinized by irrigation]/[Area equipped for irrigation: total] |
| [4446]=100*[4303]/[4313] | [% of area equipped for irrigation drained] | 100*[Area equipped for irrigation drained]/[Area equipped for irrigation: total] |
| [4448]=[4314]+[4315] | [Other agricultural water managed area] | [Flood recession cropping area non-equipped]+[Cultivated wetlands and inland valley bottoms non-equipped] |
| [4450]=100*[4263]/[4157] | [Freshwater withdrawal as % of internal renewable water resources] | 100*[Total freshwater withdrawal (primary and secondary)]/[Total internal renewable water resources (IRWR)] |
| [4455]=100*[4454]/[4101] | [Conservation agriculture area as % of arable land area] | 100*[Conservation agriculture area]/[Arable land area] |
| [4457]=[4251]*1000000/[4104] | [Municipal water withdrawal per capita (total population)] | [Municipal water withdrawal]*1000000/[Total population] |
| [4459]=[4309]+[4310] | [Area equipped for full control irrigation: pressurized (sprinkler + localized)] | [Area equipped for full control irrigation: sprinkler irrigation]+[Area equipped for full control irrigation: localized irrigation] |
| [4462]=100*[4379]/[4461] | [Harvested irrigated crop area as % of the full control irrigation area actually irrigated] | 100*[Total harvested irrigated crop area (full control irrigation)]/[Area equipped for full control irrigation: actually irrigated] |
| [4463]=100*[4461]/[4311] | [% of area equipped for full control irrigation actually irrigated] | 100*[Area equipped for full control irrigation: actually irrigated]/[Area equipped for full control irrigation: total] |
| [4464]=100*[4379]/[4461] | [Irrigated cropping intensity] | 100*[Total harvested irrigated crop area (full control irrigation)]/[Area equipped for full control irrigation: actually irrigated] |
| [4466]=100*[4465]/[4313] | [% of area equipped by direct use of treated municipal wastewater] | 100*[Area equipped by direct use of treated municipal wastewater]/[Area equipped for irrigation: total] |
| [4467]=100*[4263]/[4253] | [Freshwater withdrawal as % of total water withdrawal | 100*[Total freshwater withdrawal (primary and secondary)]/[Total water withdrawal] |
| [4468]=[4251]*1000000/[4106] | [Municipal water withdrawal per capita (urban population)] | [Municipal water withdrawal]*1000000/[Urban population] |
| [4470]=100*[4103]/[4100] | [% of total country area cultivated] | 100*[Cultivated area (arable land + permanent crops)]/[Total area of the country] |
| [4471]=1000000*[4197]/[4104] | [Dam capacity per capita] | 1000000*[Total dam capacity]/[Total population] |
| [4514]=100*[4513]/[4313] | [% of area equipped for irrigation by direct use of non-treated municipal wastewater] | 100*[Area equipped for irrigation by direct use of non-treated municipal wastewater]/[Area equipped for irrigation: total] |
| [4527]=100*[4526]/[4313] | [% of area equipped for irrigation by direct use of agricultural drainage water] | 100*[Area equipped for irrigation by direct use of agricultural drainage water]/[Area equipped for irrigation: total] |
| [4531]= [4252]*1000000/[4104] | [Industrial water withdrawal per capita] | [Industrial water withdrawal]*1000000/[Total population] |
| [4532]=[4250]*1000000/[4104] | [Agricultural water withdrawal per capita] | [Agricultural water withdrawal]*1000000/[Total population] |
| [4538]=100*[4108]/[4449] | [% of economically active population active in agriculture] | 100*[Population economically active in agriculture]/[Population economically active] |
| [4540]=100*[4539]/[4313] | [% of area equipped for irrigation by desalinated water] | 100*[Area equipped for irrigation by desalinated water]/[Area equipped for irrigation: total] |
| [4550]=100*[4263]/([4188]-[4549]) | [SDG 6.4.2. Water Stress] | 100*[Total freshwater withdrawal (primary and secondary)]/([Total renewable water resources]-[Environmental Flow Requirements] |
| [4556]=100*[4379]/[4103] | [% of cultivated land irrigated] | 100*[Total harvested irrigated crop area (full control irrigation)]/[Arable land area] |
| [4556]=100*[4461]/[4103] | [% of cultivated land irrigated] | 100*[Total harvested irrigated crop area (full control irrigation)]/[Arable land area] |
| [4555]=1001/(1+((1-([4556]/100))/(([4556]/100)[4557]))) | [% of agricultural GVA produced by irrigated agriculture] | 1/(1+((1-([% of arable land irrigated]/100))/(([% of arable land irrigated]/100)*[4557]))) |
| [4552]= ((([4548]/[4558]100)[4555]/100)/[4250])/1000000000 | [SDG 6.4.1. Irrigated Agriculture Water Use Efficiency] | (([Agriculture, value added to GDP]*[% of agricultural GVA produced by irrigated agriculture]/100)/[Agricultural water withdrawal])/1000000000 |
| [4553]=(([4546]/[4558]*100)/[4252])/1000000000 | [SDG 6.4.1. Industrial Water Use Efficiency] | ([Industry, value added to GDP]/[Industrial water withdrawal])/1000000000 |
| [4554]= (([4547]/[4558]*100)/[4251])/1000000000 | [SDG 6.4.1. Services Water Use Efficiency] | ([Services, value added to GDP]/[Municipal water withdrawal])/1000000000 |
| [4551]=([4552][4254]/100)+([4553][4256]/100)+([4554]*[4255]/100) | [SDG 6.4.1. Water Use Efficiency] | ([SDG 6.4.1. Irrigated Agriculture Water Use Efficiency][Agricultural water withdrawal as % of total water withdrawal]) + ([SDG 6.4.1. Industrial Water Use Efficiency][Industrial water withdrawal as % of total water withdrawal]) + ([SDG 6.4.1. Services Water Use Efficiency]*[Municipal water withdrawal as % of total withdrawal]) |
| [4533]=[4465] | ||
| [4534]=[4513] | ||
| [4535]=[4265] | ||
| [4536]=[4156] |
4.1.2 Vertical Imputation (components)
After the First Calculation, the module tries to retrieve some information for selected components based on the share of their indicators. This can be done only for the formulas that are linear combination. For instance, for a given country and year, an indicator and all its components are known. The idea then is to calculate the share of each component based on that indicator and fill in the gaps where the indicator is also available but the components are not. The example below illustrates the vertical imputation method.
![Bulgaria - Vertical Imputation [4311]=[4308]+[4309]+[4310]](images/vertical_imputation_example.PNG)
Figure 4.2: Bulgaria - Vertical Imputation [4311]=[4308]+[4309]+[4310]
The vertical imputation is applied on the selected elements (components). See the components by formula. Mind that none of them are LTA.
- [4100]=[4559]+[4560]
- [4253]=[4251]+[4252]+[4250]
- [4263]=[4261]+[4262]
- [4300]=[4303]+[4304]
- [4311]=[4308]+[4309]+[4310]
- [4313]=[4311]+[4312]+[4316]
- [4317]=[4313]+[4314]+[4315]
4.1.3 Linear Interpolation and Carry-Forward
The next methods to take place are the linear interpolation and carry-forward. For the elements classified as LTA (Long-Term Average), the module will just carry-forward their values as they are elements that are not supposed to change over time.
However, if the element is not LTA, the linear interpolation method takes place if there are at least two non-missing values in the time series. If not, the only possible way to impute it is through the carry-forward.
4.1.4 Recalculate indicators (Second calculation)
The time-series completeness brought by imputations is used by the recalculation step to try to calculate the remaining indicators that were still missing after the first calcualtion. This is the last step before getting the outcome.
4.2 Running the module
Log in the SWS;
Click on New Query;
Select AQUASTAT domain and aquastat_update dataset;
Select whatever country, measured element, and timePointYears;
Run the query by clicking on the Run button;

Figure 4.3: Steps 1 to 5 to run the module in the SWS.
Click on Run plugin on the top-right (see figure below);
Select the faoswsAquastatUpdate module, choose the set of countries (All countries or Session countries) and click on Run plugin on the bottom-right. Please note that the running of the plugin for all countries takes over 24 hours because of the reading/saving metadata process;

Figure 4.4: Select the faoswsAquastatUpdate and run it in the SWS.
8. Wait for the results to appear in the session;
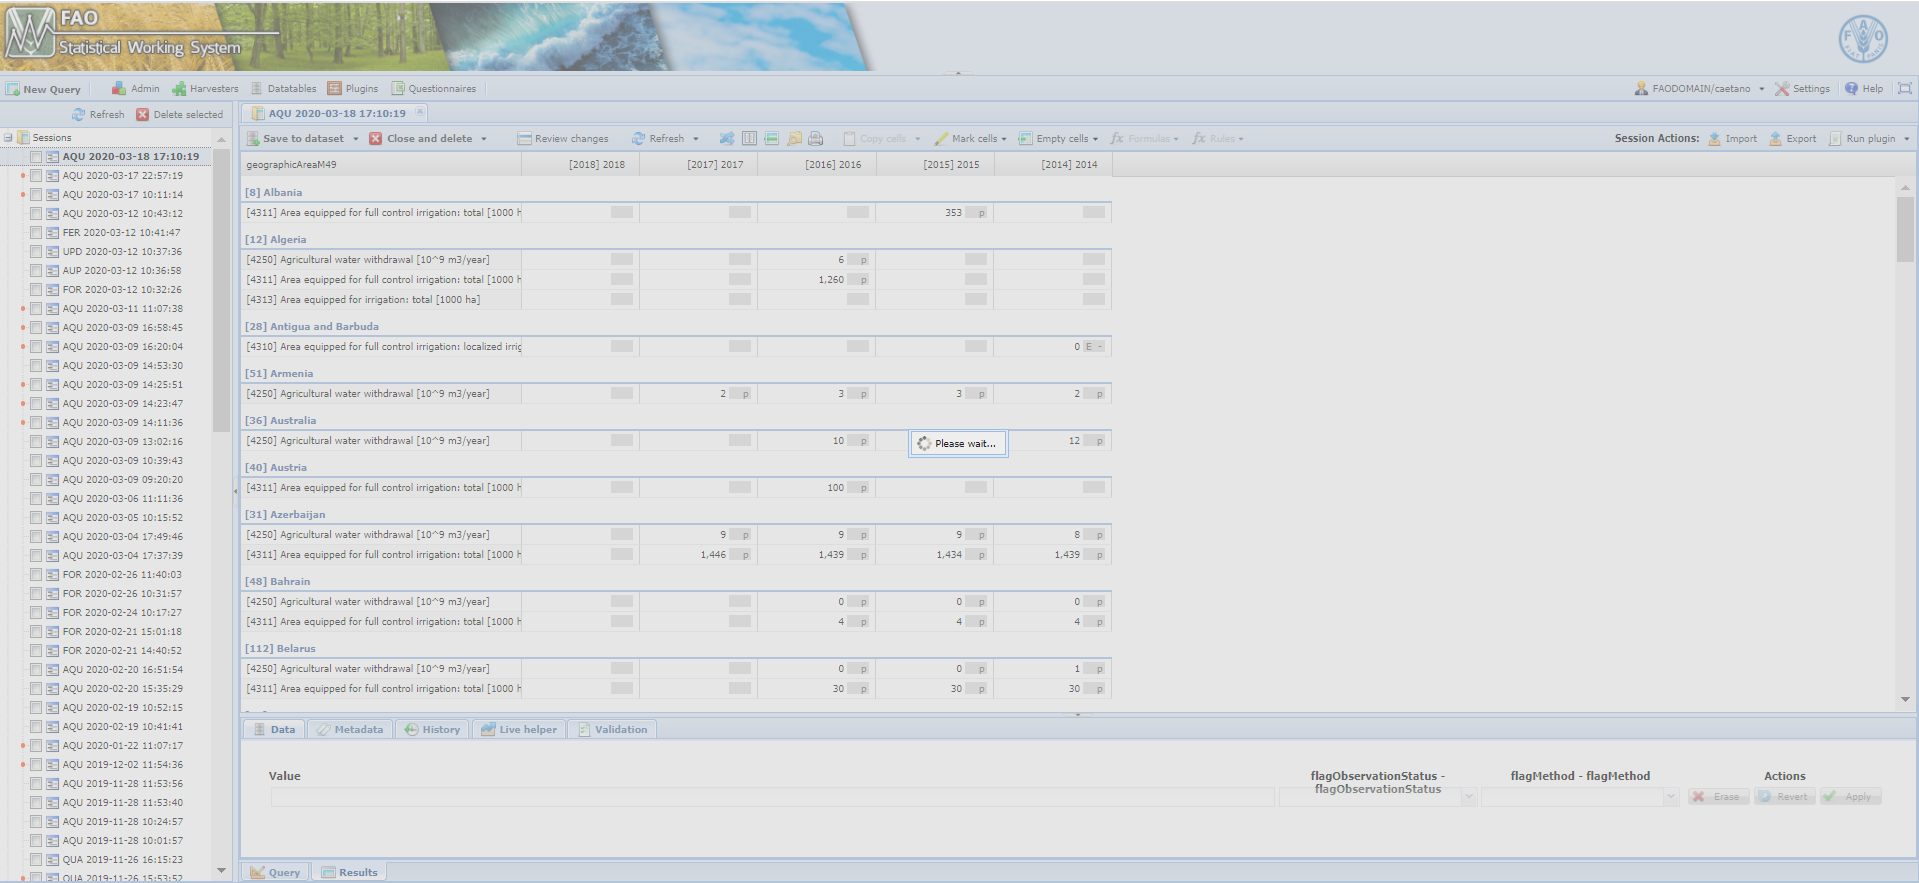
Figure 4.5: Wait for the end of the processing (~ 15 minutes).
9. Check the populated session and click on Save to dataset after validation.
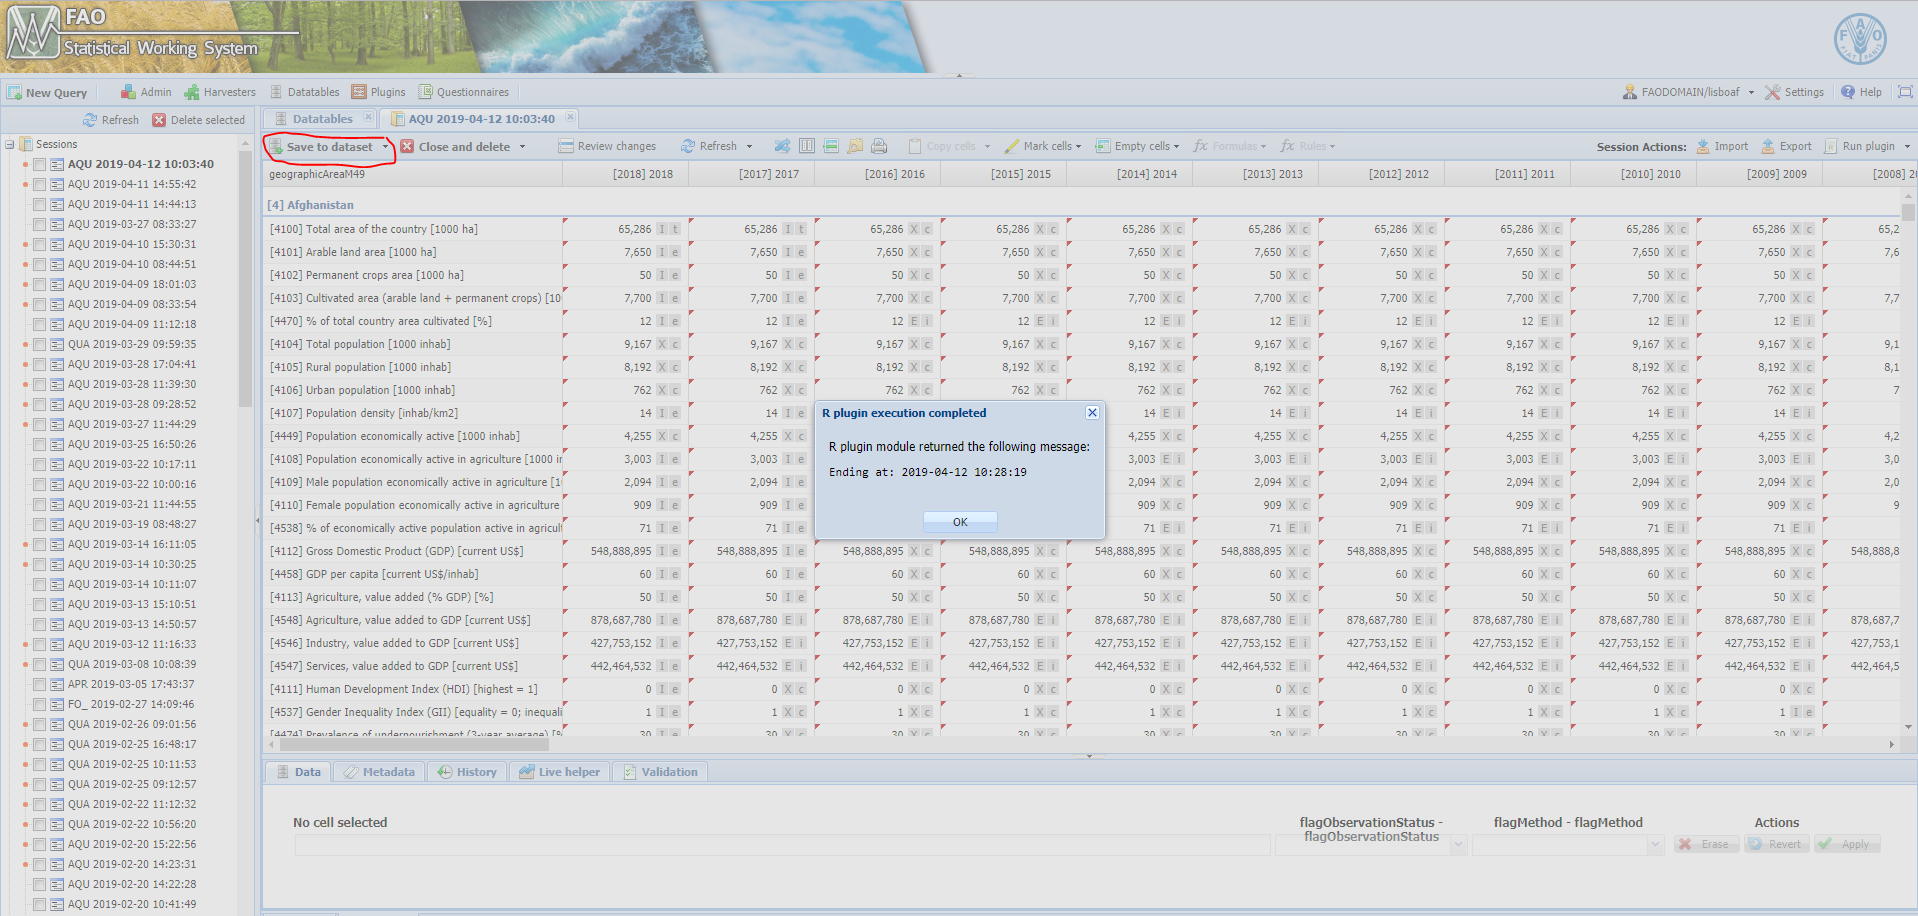
Figure 4.6: Wait for the end of the processing (~ 15 minutes).
4.3 Flag Assignment
The flag assignment constitutes a paramount step in the migration of any process to the SWS, helping to understand how the data was collected/estimated and also in the validation process. The plugin faoswsAquastatUpdate provides an important information on the metadata regarding the origin of each data point. In this way it is possible to analyse the relevance of flags by origin. See the figure below with the set of flags for each origin.
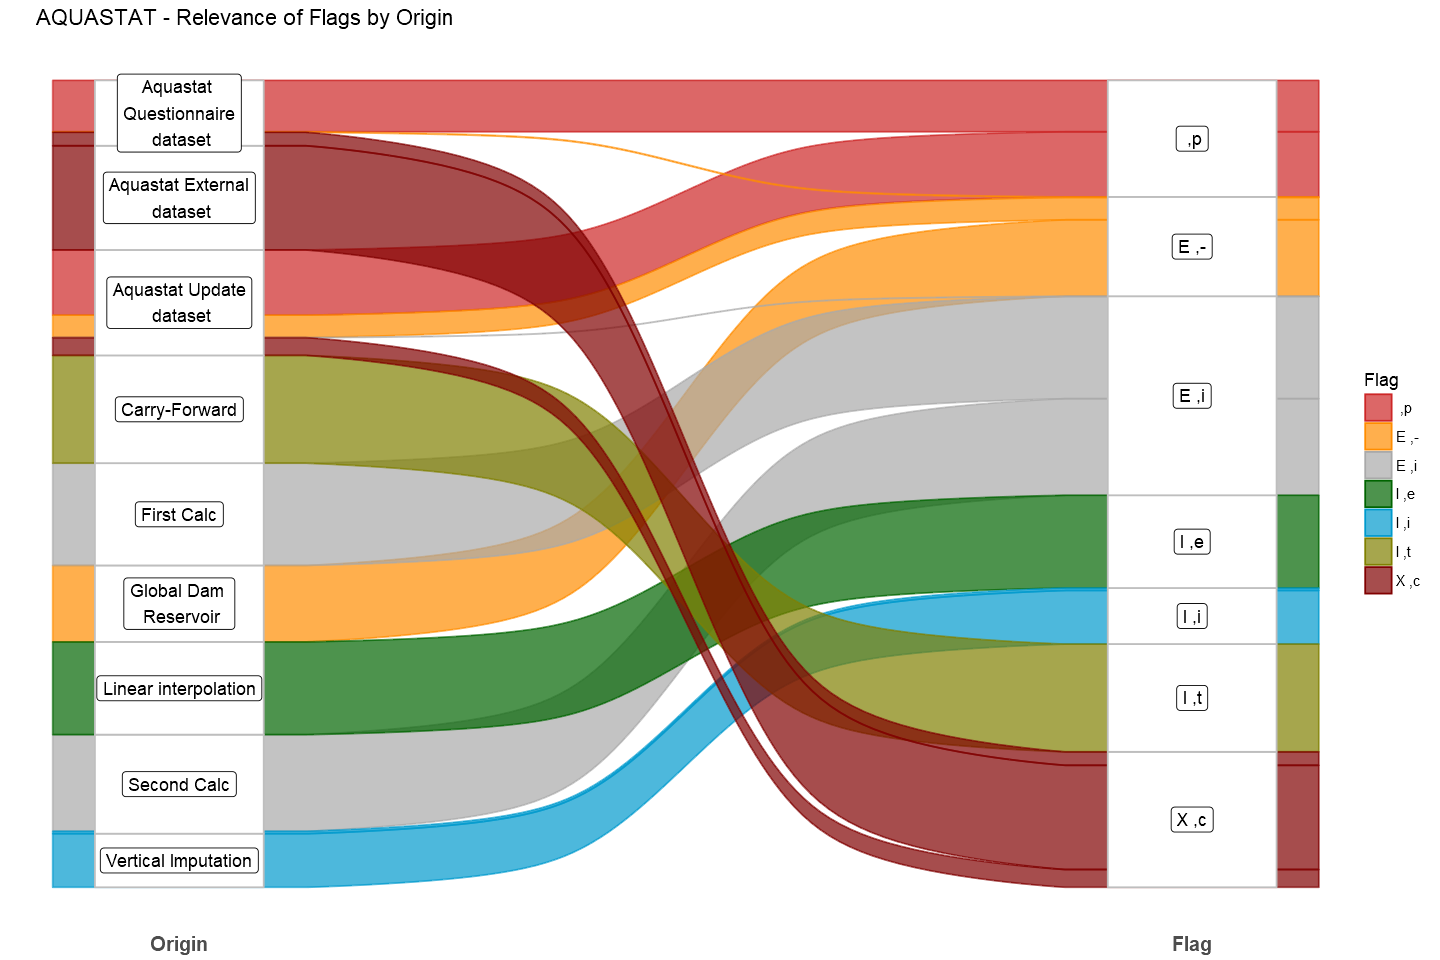
Figure 4.7: Relevance of flags by origin
Mind that the size of each rectangle is determined by the number of data points. Therefore, the flags I,t and I,e are the ones which have more relevance in the module while I,i is the one with less relevance.
4.4 AQUASTAT Network
The calculation rules are the key part of the plugin faoswsAquastatUpdate as it provides the formulas to calculate the indicators, including the SDG’s indicators.
As an indicator can be also a component of another indicator, a deeper analysis of how indicators and components are linked to each other is needed.
Below you can see how the AQUASTAT elements are connected to each other. It is important to note that there is a high concentration of elements connected, what could evidence a mutual dependency. The elements are split into three categories: Indicator, Component and Indicator&Component. For instance, 4313 has the largest circle, which means that it’s the variable that has more connections. In this case, the connections means that many indicators depend on 4313. Other networks are completely isolated, as per 4455, 4454 and 4101 (on the left of the figure).
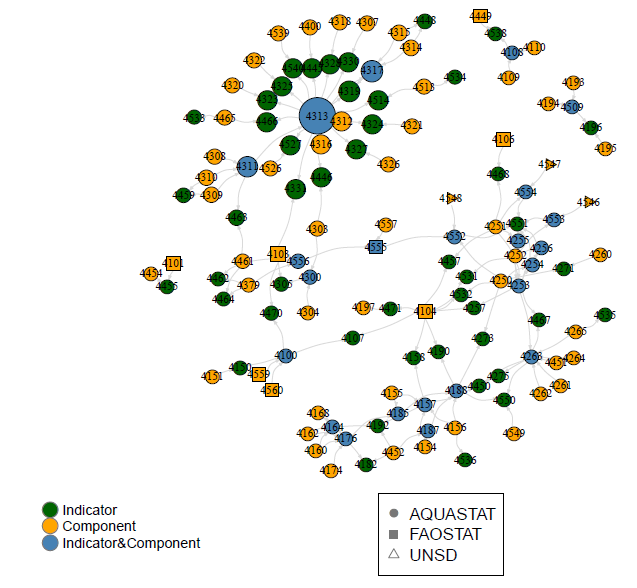
Figure 4.8: AQUASTAT Network
Despite the fact that the network above can be convoluted to understand given a high concentration of elements interconnected, the graph above is a DAG (Directed Acyclic Graph) as per the result of the test in R. This means that it contains no cycles.