Chapter 1 AQUASTAT Framework
The book focuses on the migration of the AQUASTAT statistical processes to SWS. However, for those interested, AQUASTAT has a dedicated FAO website where the new methodology for data collection and data management can be accessed. The next sections summarize the AQUASTAT data collection and information management methodology.
1.1 Data Collection
Data collection relies on a network of AQUASTAT national correspondents in charge of the provision of official national data;
As of August 2020, 150 countries have nominated AQUASTAT national correspondents as requested by FAO Land and Water Division between April-May 2018;
Alternate correspondents from different agencies are also used to improve the data collection;
The FAO Office of the Chief Statistician (OCS) has endorsed the annual Water and Agriculture questionnaire as well as the long version of the 2020 questionnaire to be sent every 5 years;
AQUASTAT sends out the questionnaire in the first semester of each year.
1.2 Questionnaire
The Water and Agriculture questionnaire has the following characteristics:
Three introductory sections: Cover page, Instructions, Definitions;
One data reporting section, including national data on water withdrawal, municipal wastewater, irrigation and drainage;
Four Supplementary Information sections: SDG 6.4.1 and 6.4.2 calculation sheets, Metadata, Feedback.
- To download the annual Water and Agriculture questionnaire, please click on this link.
1.3 The current AQUASTAT information management
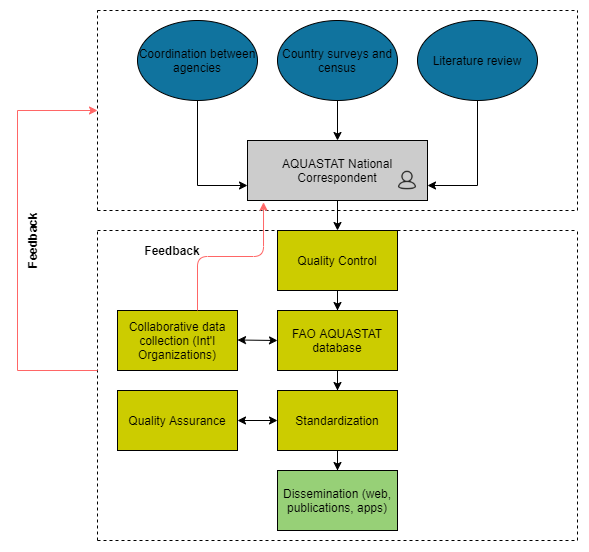
Figure 1.1: Aquastat Information Management
1.4 AQUASTAT in SWS: proposed dataflow
AQUASTAT dataflow will predominantly be triggered by the filling and compilation of the Water and Agriculture questionnaire by the AQUASTAT network of National Correspondents. In the future, a tailored questionnaire harvester could be created in collaboration with CSI to automatically extract data from filled surveys and output it as an SWS compliant dataset. Once in the SWS, the technical unit will benefit from the tools and other features that have been developed to make the AQUASTAT dataflow as seamless as possible. On this basis, the flowchart below gives the AQUASTAT dataflow that has been fostered by the ESS - SWS team.
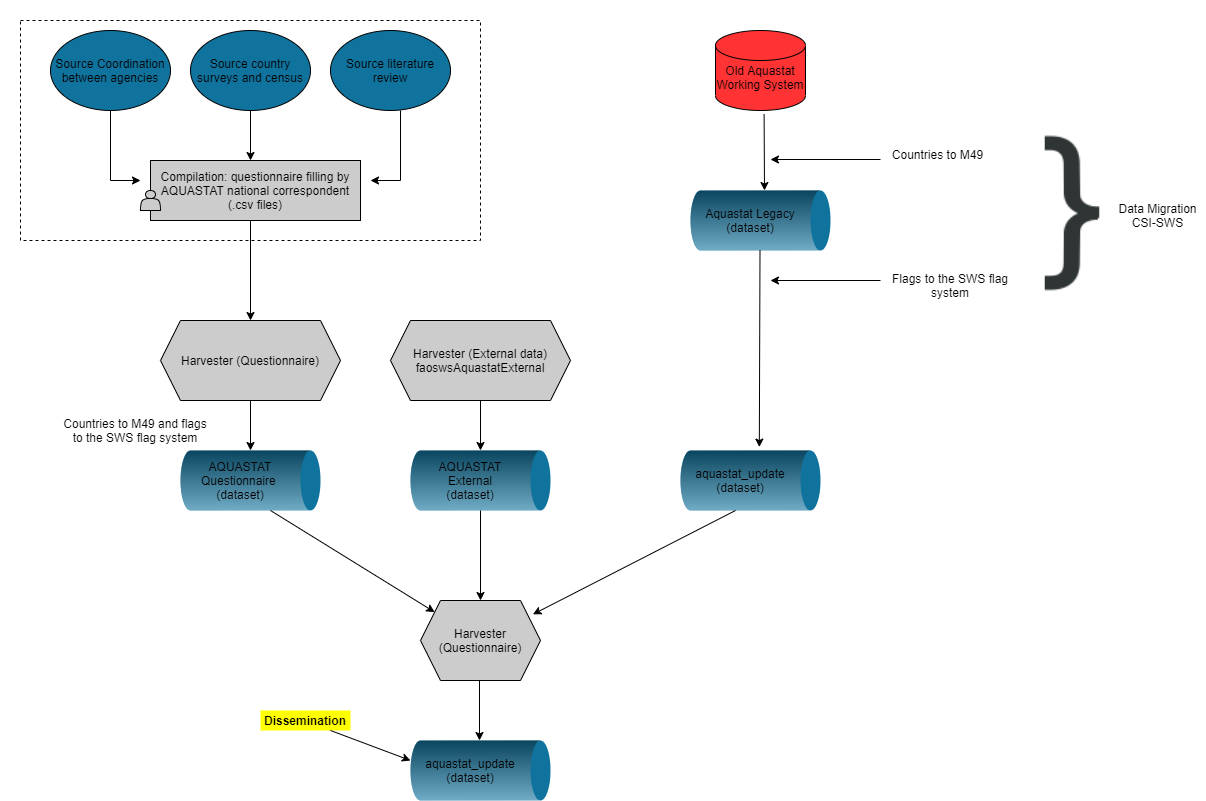
Figure 1.2: Developed AQUATAST - SWS dataflow
1.5 AQUASTAT Elements
The next chapters will treat the modules as well as their datasets and datatables in more details. However, after describing the current SWS resources involved in the AQUASTAT - SWS migration framework, it is important to have a look at how the technical units references its data and the list of the data collected, processed, and disseminated.
1.5.1 International Classification Systems
AQUASTAT datasets use the following international classification systems to reference its elements:
The International Standard Industrial Classification of All Economic Activities: ISIC4;
The System of Environmental-Economic Accounting for Water: SEEA-Water for water resources and withdrawals;
The World Census of Agriculture 2020: WCA (Volume 1), for irrigation definitions.
1.5.2 Current AQUASTAT Variables
Variables are AQUASTAT elements that are non-calculated. These can be from different sources as described in the table below.
| element_code | element_name | disseminated |
|---|---|---|
| 4100 | Total area of the country | D |
| 4101 | Arable land area | D |
| 4102 | Permanent crops area | D |
| 4104 | Total population | D |
| 4106 | Urban population | D |
| 4109 | Male population economically active in agriculture | I |
| 4110 | Female population economically active in agriculture | I |
| 4111 | Human Development Index (HDI) [highest = 1] | D |
| 4112 | Gross Domestic Product (GDP) | D |
| 4113 | Agriculture, value added (% GDP) | D |
| 4114 | Total population with access to improved drinking-water source (JMP) | D |
| 4115 | Rural population with access to improved drinking-water source (JMP) | D |
| 4116 | Urban population with access to improved drinking-water source (JMP) | D |
| 4151 | Long-term average annual precipitation in depth | D |
| 4152 | Evaporation from artificial lakes and reservoirs | I |
| 4153 | Water resources produced internally in a 10th dry year frequency | I |
| 4154 | Groundwater produced internally | D |
| 4155 | Surface water produced internally | D |
| 4156 | Overlap between surface water and groundwater | D |
| 4159 | Surface water: entering the country (total) | D |
| 4161 | Surface water: inflow submitted to treaties | D |
| 4162 | Surface water: inflow secured through treaties | D |
| 4165 | Surface water: total flow of border rivers | D |
| 4168 | Surface water: accounted flow of border rivers | D |
| 4171 | Surface water: leaving the country to other countries (total) | D |
| 4172 | Surface water: outflow to other countries not submitted to treaties | D |
| 4173 | Surface water: outflow to other countries submitted to treaties | D |
| 4174 | Surface water: outflow to other countries secured through treaties | D |
| 4177 | Groundwater: entering the country (total) | D |
| 4178 | Groundwater: leaving the country to other countries (total) | D |
| 4193 | Exploitable: regular renewable surface water | D |
| 4194 | Exploitable: irregular renewable surface water | D |
| 4195 | Exploitable: regular renewable groundwater | D |
| 4197 | Total dam capacity | D |
| 4250 | Agricultural water withdrawal | D |
| 4251 | Municipal water withdrawal | D |
| 4252 | Industrial water withdrawal | D |
| 4260 | Irrigation water requirement | D |
| 4264 | Desalinated water produced | D |
| 4265 | Direct use of treated municipal wastewater | D |
| 4266 | Depletion rate of renewable groundwater resources | I |
| 4267 | Abstraction of fossil groundwater | I |
| 4268 | Expected time that fossil groundwater will last | I |
| 4269 | Produced municipal wastewater | D |
| 4270 | Treated municipal wastewater | D |
| 4261 | Fresh surface water withdrawal | D |
| 4262 | Fresh groundwater withdrawal | D |
| 4303 | Area equipped for irrigation drained | D |
| 4304 | Non-irrigated cultivated area drained | D |
| 4306 | Water harvesting area | I |
| 4307 | Irrigation potential | D |
| 4308 | Area equipped for full control irrigation: surface irrigation | D |
| 4309 | Area equipped for full control irrigation: sprinkler irrigation | D |
| 4310 | Area equipped for full control irrigation: localized irrigation | D |
| 4312 | Area equipped for irrigation: equipped lowland areas | D |
| 4314 | Flood recession cropping area non-equipped | D |
| 4315 | Cultivated wetlands and inland valley bottoms non-equipped | D |
| 4316 | Area equipped for irrigation: spate irrigation | D |
| 4318 | Area equipped for irrigation: actually irrigated | D |
| 4320 | Area equipped for irrigation by groundwater | D |
| 4321 | Area equipped for irrigation by surface water | D |
| 4322 | Area equipped for irrigation by mixed surface water and groundwater | D |
| 4326 | Area equipped for power irrigation (surface water or groundwater) | D |
| 4329 | % of total grain production irrigated | D |
| 4332 | Total area of small irrigation schemes | I |
| 4333 | Total area of medium irrigation schemes | I |
| 4334 | Total area of large irrigation schemes | I |
| 4335 | Average cost of irrigation development in public schemes | I |
| 4336 | Average cost of operation and maintenance in public schemes | I |
| 4337 | Average cost of drainage development in public schemes | I |
| 4338 | Average cost of irrigation rehabilitation in public schemes | I |
| 4339 | Average cost of irrigation development in private schemes | I |
| 4340 | Average cost of operation and maintenance cost in private schemes | I |
| 4341 | Average cost of drainage development in private schemes | I |
| 4342 | Average cost of irrigation rehabilitation in private schemes | I |
| 4343 | Average cost of installation of sprinkler irrigation: on farm | I |
| 4344 | Average cost of installation of localized irrigation: on farm | I |
| 4345 | Harvested irrigated temporary crop area: Wheat | D |
| 4346 | Harvested irrigated temporary crop area: Rice | D |
| 4347 | Harvested irrigated temporary crop area: Barley | D |
| 4348 | Harvested irrigated temporary crop area: Maize | D |
| 4349 | Harvested irrigated temporary crop area: Millet | D |
| 4350 | Harvested irrigated temporary crop area: Sorghum | D |
| 4351 | Harvested irrigated temporary crop area: Other cereals | D |
| 4352 | Harvested irrigated temporary crop area: Potatoes | D |
| 4353 | Harvested irrigated temporary crop area: Sweet Potatoes | D |
| 4354 | Harvested irrigated temporary crop area: Cassava | D |
| 4355 | Harvested irrigated temporary crop area: Other roots and tubers | D |
| 4356 | Harvested irrigated permanent crop area: Plantains | D |
| 4357 | Harvested irrigated temporary crop area: Sugarcane | D |
| 4358 | Harvested irrigated temporary crop area: Sugar beet | D |
| 4359 | Harvested irrigated temporary crop area: Leguminous crops | D |
| 4360 | Harvested irrigated temporary crop area: Vegetables | D |
| 4361 | Harvested irrigated permanent crop area: Bananas | D |
| 4362 | Harvested irrigated permanent crop area: Citrus | D |
| 4363 | Harvested irrigated permanent crop area: Cocoa beans | D |
| 4364 | Harvested irrigated permanent crop area: Coffee | D |
| 4365 | Harvested irrigated permanent crop area: Tea | D |
| 4366 | Harvested irrigated temporary crop area: tobacco | D |
| 4367 | Harvested irrigated temporary crop area: Cotton | D |
| 4368 | Harvested irrigated permanent crop area: Rubber | D |
| 4369 | Harvested irrigated temporary crop area: Fodder | D |
| 4370 | Harvested irrigated permanent crop area: Oil palm | D |
| 4371 | Harvested irrigated temporary crop area: Soybeans | D |
| 4372 | Harvested irrigated temporary crop area: Groundnuts | D |
| 4373 | Harvested irrigated temporary crop area: Sunflower | D |
| 4374 | Harvested irrigated temporary crop area: Sesame | D |
| 4375 | Harvested irrigated permanent crop area: Coconuts | D |
| 4376 | Harvested irrigated temporary crop area: Flowers | D |
| 4377 | Harvested irrigated temporary crop area: Other crops | D |
| 4378 | Harvested irrigated permanent crop area: Other crops | D |
| 4379 | Total harvested irrigated crop area (full control irrigation) | D |
| 4400 | Area salinized by irrigation | D |
| 4401 | Area waterlogged by irrigation | D |
| 4403 | Population affected by water related disease | D |
| 4410 | Irrigated crop yield: Wheat | I |
| 4411 | Irrigated crop yield: Rice | I |
| 4412 | Irrigated crop yield: Barley | I |
| 4413 | Irrigated crop yield: Maize | I |
| 4414 | Irrigated crop yield: Millet | I |
| 4415 | Irrigated crop yield: Sorghum | I |
| 4416 | Irrigated crop yield: Other cereals | I |
| 4417 | Irrigated crop yield: Potatoes | I |
| 4418 | Irrigated crop yield: Sweet potatoes | I |
| 4419 | Irrigated crop yield: Cassava | I |
| 4420 | Irrigated crop yield: Other roots and tubers | I |
| 4421 | Irrigated crop yield: Plantain | I |
| 4422 | Irrigated crop yield: Sugar cane | I |
| 4423 | Irrigated crop yield: Sugar beet | I |
| 4424 | Irrigated crop yield: Pulses | I |
| 4425 | Irrigated crop yield: Vegetables | I |
| 4426 | Irrigated crop yield: Bananas | I |
| 4427 | Irrigated crop yield: Citrus | I |
| 4428 | Irrigated crop yield: Cocoa beans | I |
| 4429 | Irrigated crop yield: Coffee | I |
| 4430 | Irrigated crop yield: Tea | I |
| 4431 | Irrigated crop yield: Tobacco | I |
| 4432 | Irrigated crop yield: Cotton | I |
| 4433 | Irrigated crop yield: Rubber | I |
| 4434 | Irrigated crop yield: Fodder | I |
| 4435 | Irrigated crop yield: Oil palm | I |
| 4436 | Irrigated crop yield: Soybeans | I |
| 4437 | Irrigated crop yield: Groundnuts | I |
| 4438 | Irrigated crop yield: Sunflower | I |
| 4439 | Irrigated crop yield: Sesame | I |
| 4440 | Irrigated crop yield: Coconuts | I |
| 4441 | Irrigated crop yield: Flowers | I |
| 4449 | Population economically active | I |
| 4451 | Direct use of agricultural drainage water | D |
| 4452 | Groundwater: accounted inflow | D |
| 4453 | Groundwater: accounted outflow to other countries | D |
| 4454 | Conservation agriculture area | D |
| 4460 | Water withdrawal for cooling of thermoelectric plants | I |
| 4461 | Area equipped for full control irrigation: actually irrigated | D |
| 4465 | Area equipped by direct use of treated municipal wastewater | D |
| 4469 | Permanent meadows and pastures irrigated | D |
| 4472 | National Rainfall Index (NRI) | D |
| 4473 | Number of people undernourished (3-year average) | D |
| 4474 | Prevalence of undernourishment (3-year average) | D |
| 4475 | Irrigation water withdrawal | D |
| 4476 | Water withdrawal for livestock (water and cleaning) | I |
| 4477 | Water withdrawal for aquaculture | I |
| 4478 | Freshwater withdrawal by households (self-abstracted) | I |
| 4479 | Water withdrawal for manufactured products | I |
| 4480 | Water withdrawal for other industries | I |
| 4481 | Agricultural fresh surface water withdrawal (self-abstracted) | I |
| 4482 | Industrial fresh surface water withdrawal (self-abstracted) | I |
| 4483 | Municipal fresh surface water withdrawal (self-abstracted) | I |
| 4484 | Agricultural fresh groundwater withdrawal (self-abstracted) | I |
| 4485 | Industrial fresh groundwater withdrawal (self-abstracted) | I |
| 4486 | Municipal fresh groundwater withdrawal (self-abstracted) | I |
| 4487 | Agricultural freshwater withdrawal (self-abstracted) | I |
| 4488 | Industrial freshwater withdrawal (self-abstracted) | I |
| 4489 | Municipal freshwater withdrawal (total) | I |
| 4490 | Direct use of treated municipal wastewater for irrigation purposes | D |
| 4491 | Not treated municipal wastewater | D |
| 4492 | Fresh groundwater withdrawal for irrigation (self-abstracted) | I |
| 4493 | Collected municipal wastewater | D |
| 4494 | Desalinated water for municipalities | I |
| 4495 | Desalinated water for agriculture | I |
| 4496 | Freshwater withdrawal by water supply entity | I |
| 4497 | Fresh surface water withdrawal for irrigation (self-abstracted) | I |
| 4498 | Freshwater withdrawal by services (self-abstracted) | I |
| 4499 | Water from Water Supply Entity used by agriculture | I |
| 4500 | Water from Water Supply Entity used by industry | I |
| 4501 | Water from Water Supply Entity used by households | I |
| 4502 | Total water used (withdrawal + WSE) | I |
| 4503 | Total water used by agriculture | I |
| 4504 | Total water used by industry | I |
| 4505 | Total water used by households | I |
| 4506 | Total Water Supply Entity (WSE) water used | I |
| 4507 | Freshwater withdrawal for irrigation (self-abstracted) | I |
| 4508 | In-stream water usage by hydropower plants | I |
| 4510 | Treated municipal wastewater discharged (secondary water) | D |
| 4511 | Water reserved for ecosystems | I |
| 4512 | Direct use of the not treated municipal wastewater for irrigation purposes | D |
| 4513 | Area equipped for irrigation by direct use of non-treated municipal wastewater | D |
| 4515 | Number of municipal wastewater treatment facilities | D |
| 4516 | Capacity of the municipal wastewater treatment facilities | D |
| 4517 | Not treated municipal wastewater discharged (secondary water) | D |
| 4520 | Harvested irrigated temporary crop area: Total | D |
| 4521 | Harvested irrigated permanent crop area: Total | D |
| 4522 | Harvested irrigated permanent crop area: Grass and Fodder | D |
| 4523 | Harvested irrigated permanent crop area: Grapes | D |
| 4524 | Harvested irrigated permanent crop area: Other fruits | D |
| 4525 | Harvested irrigated permanent crop area: Olives | D |
| 4526 | Area equipped for irrigation by direct use of agricultural drainage water | D |
| 4530 | Produced industrial wastewater | I |
| 4537 | Gender Inequality Index (GII) | D |
| 4539 | Area equipped for irrigation by desalinated water | D |
| 4541 | Interannual variability (WRI) | D |
| 4542 | Seasonal variability (WRI) | D |
| 4543 | Flood occurrence (WRI) | D |
| 4544 | % of the area equipped for irrigation managed by women | D |
| 4545 | % of the agricultural holdings with irrigation managed by women | D |
| 4549 | Environmental Flow Requirements | D |
| 4557 | Ratio between rainfed and irrigated yields | I |
| 4559 | Land area | I |
| 4560 | Inland waterd | I |
| 4546 | Industry, value added to GDP | I |
| 4547 | Services, value added to GDP | I |
| 4548 | Agriculture, value added to GDP | I |
| 4160 | Surface water: inflow not submitted to treaties | D |
1.5.3 Current AQUASTAT indicators
The indicators in AQUASTAT are calculated variables.| element_code | element_name | disseminated | calculated | source |
|---|---|---|---|---|
| 4103 | Cultivated area (arable land + permanent crops) | D | C | FAOSTAT |
| 4105 | Rural population | D | C | FAOSTAT |
| 4107 | Population density | D | C | DERIVED |
| 4108 | Population economically active in agriculture | I | C | DERIVED |
| 4150 | Long-term average annual precipitation in volume | D | C | DERIVED |
| 4157 | Total internal renewable water resources (IRWR) | D | C | DERIVED |
| 4158 | Total internal renewable water resources per capita | D | C | DERIVED |
| 4164 | Surface water: accounted inflow | D | C | DERIVED |
| 4176 | Surface water: total external renewable | D | C | DERIVED |
| 4182 | Water resources: total external renewable | D | C | DERIVED |
| 4185 | Total renewable surface water | D | C | DERIVED |
| 4187 | Total renewable groundwater | D | C | DERIVED |
| 4188 | Total renewable water resources | D | C | DERIVED |
| 4190 | Total renewable water resources per capita | D | C | DERIVED |
| 4192 | Dependency ratio | D | C | DERIVED |
| 4196 | Total exploitable water resources | D | C | DERIVED |
| 4253 | Total water withdrawal | D | C | DERIVED |
| 4254 | Agricultural water withdrawal as % of total water withdrawal | D | C | DERIVED |
| 4255 | Municipal water withdrawal as % of total withdrawal | D | C | DERIVED |
| 4256 | Industrial water withdrawal as % of total water withdrawal | D | C | DERIVED |
| 4257 | Total water withdrawal per capita | D | C | DERIVED |
| 4271 | Agricultural water requirement as % of agricultural water withdrawal | I | C | DERIVED |
| 4273 | Agricultural water withdrawal as % of total renewable water resources | D | C | DERIVED |
| 4263 | Total freshwater withdrawal | D | C | DERIVED |
| 4275 | MDG 7.5. Freshwater withdrawal as % of total renewable water resources | D | C | DERIVED |
| 4300 | Total cultivated area drained | D | C | DERIVED |
| 4305 | % of total cultivated area drained | D | C | DERIVED |
| 4311 | Area equipped for full control irrigation: total | D | C | DERIVED |
| 4313 | Area equipped for irrigation: total | D | C | DERIVED |
| 4317 | Total agricultural water managed area | D | C | DERIVED |
| 4319 | % of agricultural water managed area equipped for irrigation | D | C | DERIVED |
| 4323 | % of area equipped for irrigation by groundwater | D | C | DERIVED |
| 4324 | % of area equipped for irrigation by surface water | D | C | DERIVED |
| 4325 | % of area equipped for irrigation by mixed surface water and groundwater | D | C | DERIVED |
| 4327 | % of area equipped for irrigation power irrigated | D | C | DERIVED |
| 4328 | % of the area equipped for irrigation actually irrigated | D | C | DERIVED |
| 4330 | % of irrigation potential equipped for irrigation | D | C | DERIVED |
| 4331 | % of the cultivated area equipped for irrigation | D | C | DERIVED |
| 4445 | % of area equipped for irrigation salinized | D | C | DERIVED |
| 4446 | % of area equipped for irrigation drained | D | C | DERIVED |
| 4448 | Other agricultural water managed area | I | C | DERIVED |
| 4450 | Freshwater withdrawal as % of internal renewable water resources | I | C | DERIVED |
| 4455 | Conservation agriculture area as % of arable land area | D | C | DERIVED |
| 4457 | Municipal water withdrawal per capita (total population) | I | C | DERIVED |
| 4458 | GDP per Capita | D | C | DERIVED |
| 4459 | Area equipped for full control irrigation: pressurized (sprinkler + localized) | I | C | DERIVED |
| 4462 | Harvested irrigated crop area as % of the full control irrigation area actually irrigated | I | C | DERIVED |
| 4463 | % of area equipped for full control irrigation actually irrigated | D | C | DERIVED |
| 4464 | Irrigated cropping intensity | D | C | DERIVED |
| 4466 | % of area equipped by direct use of treated municipal wastewater | D | C | DERIVED |
| 4467 | Freshwater withdrawal as % of total water withdrawal | I | C | DERIVED |
| 4468 | Municipal water withdrawal per capita (urban population) | I | C | DERIVED |
| 4470 | % of total country area cultivated | D | C | DERIVED |
| 4471 | Dam capacity per capita | D | C | DERIVED |
| 4509 | Exploitable: total renewable surface water | D | C | DERIVED |
| 4514 | % of area equipped for irrigation by direct use of non-treated municipal wastewater | D | C | DERIVED |
| 4527 | % of area equipped for irrigation by direct use of agricultural drainage water | D | C | DERIVED |
| 4531 | Industrial water withdrawal per capita | I | C | DERIVED |
| 4532 | Agricultural water withdrawal per capita | I | C | DERIVED |
| 4533 | Area equipped by direct use of treated municipal wastewater | D | C | DERIVED |
| 4534 | Area equipped by direct use of not treated municipal wastewater | D | C | DERIVED |
| 4535 | Direct use of treated municipal wastewater | D | C | DERIVED |
| 4536 | Overlap: between surface water and groundwater | D | C | DERIVED |
| 4538 | % of economically active population active in agriculture | I | C | DERIVED |
| 4540 | % of area equipped for irrigation by desalinated water | D | C | DERIVED |
| 4550 | SDG 6.4.2. Water Stress | D | C | DERIVED |
| 4551 | SDG 6.4.1. Water Use Efficiency | I | C | DERIVED |
| 4552 | SDG 6.4.1. Irrigated Agriculture Water Use Efficiency | I | C | DERIVED |
| 4553 | SDG 6.4.1. Industrial Water Use Efficiency | I | C | DERIVED |
| 4554 | SDG 6.4.1. Services Water Use Efficiency | I | C | DERIVED |
| 4555 | % of agricultural GVA produced by irrigated agriculture | I | C | DERIVED |
| 4556 | % of arable land irrigated | I | C | DERIVED |
| 4558 | GDP deflator (2015) | I | C | DERIVED |
1.5.4 Current External data
The AQUASTAT calculated variables Rural Population and Cultivated area (arable land + permanent crops) are actually not calculated variables as they can be extracted from FAOSTAT. To solve it, the faoswsAquastatExternal module extracts these and other external data used by AQUASTAT and save them in the SWS-complaint aquastat_external dataset. This dataset is then used as one of the inputs of the faoswsAquastatUpdate module.
IMPORTANT: FAOSTAT data used by AQUASTAT is an in-house source, but in the faoswsAquastatExternal module it is being treated as an external source to facilitate the workflow.