Migration of Fishery SUA and FBS compilation into the SWS
Charlotte Taglioni (Statistician, ESSD - Methodological Innovation Team)
2020-10-26
Introduction
FAO Fisheries and Aquaculture Department is migrating its statistical processes into the Corporate Statistical Working System (SWS). This online book documents the significant steps that have been taken so far concerning this migration. The document describes the main institutional actors involved in the migration as well as the FIAS - SWS resources (code lists, datasets, data tables) that have been created to support the SWS plugins (R modules) to meet technical unit requirements. Furthermore, the SWS plugins and Shiny applications are presented in the form of chapters providing a detailed description of their workflows as well as results.
IMPORTANT: Use the Chrome browser to have a correct visualization of HTML outputs in this online document.
Migration actors
Any migration into the SWS requires the interaction between at least three actors:
- The technical unit interested in automating either some or all its analytic processes in the SWS. The technical unit can be treated as client demanding services from the counterparts responsible for the implementation of its data and statistical assets in the SWS. Therefore, a successful FIAS - SWS migration depends on the coordination between the technical division and other parts. In the FIAS - SWS migration framework the technical unit is called FIAS and is represented by:
- Stefania Vannuccini Senior Fishery Officer, FIAS
- Adrienne Egger Fishery Officer, FIAS
- Gabriella Laurenti Statistical clerk, FIAS
- Thomas Berger Statistician, FIAS
- The ESS - Methodological Innovation Team (ESS - SWS) responsible for the implementation and documentation of the required statistical processes. From the ESS - SWS team the focal points for FIAS - SWS process migration are:
- Charlotte Taglioni Statistician (ESSD)
- Carola Fabi Senior Statistician (ESSD)
- The CIO - SWS the primary backend and frontend maintainer of the SWS and responsible for the implementation and documentation of non-statistical processes (IT infrastructure). The CIO - SWS team have as interlocutors:
- Enrico Anello Full Stack Developer (CIO)
- John Rowell Information Technology Officer (CIO)
- Matteo Terrinoni Lead Front End developer (CIO)
New FIAS methodology
The book focuses on SWS statistical processes and only recalls old methodology if useful to understand the new one. However, FIAS documents describing the old methodology can be found in the shared folder of the SWS.
SUAs/FBS for fish and fish products (based on FIAS documentation)
A Food Balance Sheet (FBS) for fish and fishery products presents a comprehensive picture of the pattern of a country’s fish supply and its utilization during a specified reference period. The total quantity of fish and fish products produced in a country added to the total quantity imported and adjusted to any change in stocks minus exports, gives the supply available for the indicated reference period.
The FBS of fish and fishery products represent a compendium of five decades of statistics of apparent consumption for fish and fishery products for 221 countries based on the Supply/Utilization Accounts (SUAs). The Fishery module maintains SUAs for eight groups of primary fishery commodities and ten groups of products derived from them for almost all the countries and areas in the world from 1961, on a calendar-year basis.
The compilation of SUAs and FBS, according to FAO current methodology, is a statistical exercise drawing together data from various sectors, for example production and trade, on the basis of information available in a given period – in general calendar year. In constructing the SUAs and the FBS derived from them, data available in the databases of the Statistics and Information Branch of the Fisheries and Aquaculture Department (FIAS) are used. These series are regularly updated and revised in the light of any new information. SUAs contain data on supplies from different sources matched against the different forms of utilization of each product. In this way, SUAs series for each primary and processed fishery commodities are calculated.
Classifications
In FIAS capture and aquaculture data are collected according to the ASFIS list of Species for Fishery Statistics Purposes. This is the list of species selected on the basis of their interest or relation to fisheries and aquaculture.
For each species item stored in a record, the following descriptors are available:
3-alpha code
This is a code developed by the CWP for tabulations, questionnaires and publications in which the lack of space may impede the use of adequate descriptors in all the languages required
It is assigned to a species item permanently (it is, thus, a permanent reference to that species item)
The 3-alpha code is issued only for species of commercial significance
FAO is the depository agency for the 3-alpha codes: requests for information and for the allocation of a 3-alpha code to new species should be addressed to FAO.
ISSCAAP code
The International Standard Statistical Classification for Aquatic Animals and Plants (ISSCAAP) classifies aquatic commercial species into 50 groups and nine divisions on the basis of their taxonomic, ecological and economic characteristics
Currently, all species in the ASFIS List are classified by ISSCAAP group, with the exception of marine birds and snakes
taxonomic code
The taxonomic code consists of five levels of aggregation (Main groupings, Orders, Families, Genera and Species)
Taxonomic information (scientific name, author(s), family, and higher taxonomic classification
More information about ASFIS is available at http://www.fao.org/fishery/collection/asfis/en and from this website you can download its 2018 version.
For production of processed and preserved commodities as well as for trade of fish and fisheries products (i.e. commodities), the classification being used is the International Standard Statistical Classification of Fisheries Commodities (ISSCFC). It covers products derived from fish, crustaceans, molluscs and other aquatic animals, plants and residues. This classification is based on the structure of the United Nations Standard International Trade Classification (SITC), with additional codes to include links to ISSCAAP and breakdown by additional species and product forms. It includes links to the Harmonized System classification (HS) and to the Central Product Classification (CPC). In the ISSCFC, fisheries and aquaculture commodities are classified according to the species and to the degree of processing undergone.
The classification being used for the calculation of FBS/SUAs of fish and fishery products is the ICS FAOSTAT. Fish and fish products contained in SUAs/FBS do not represent individual species or commodities, but the aggregation of different species and products. About 2000 species produced and 1000 items traded are conveyed into 8 main groups of similar biological characteristic, reflecting the ISSCAAP classification, with a further breakdown up to 11 groups in the case of SUAs.
The main eight groups of species forming SUAs and FBS for fish and fishery products are:
- Freshwater and Diadromous fish;
- Demersal fish;
- Pelagic fish;
- Marine fish other;
- Crustaceans;
- Molluscs, excluding cephalopods;
- Cephalopods;
- Other aquatic animals.
There are plans to split “Freshwater & diadromous fish” into two groups: “Freshwater fish” and “Diadromous fish” as well to split “Pelagic fish” into two groups: “Tunas, bonitos, billfishes” and “Other pelagic fish”.
Currently the SUAs/FBS for aquatic plants are not calculated (with the exception of three countries in FAOSTAT) due to the lack of separate data for edible/non-edible trade until recently. Due to the improvement of the HS classification and the introduction of specific codes distinguishing edible from non-edible aquatic plants/seaweed, this could change in the near future.
Product types according to utilization for SUAs
- fresh, whole
- frozen, whole
- fresh fillets
- frozen fillets
- cured
- canned
- prepared
- meals
- body oils*
- liver oils*
- meals from offals*
- *not included in the standardization process
The above classifications are available in the SWS with the following dimensions:
- the coding of the ICS_FAOSTAT classification for SUAs/FBS: measuredItemFAOSTAT_L2
- the element coding used in the SUAs/FBS calculation: measuredElementSuaFbs
- the FAO ISSCAAP classification and its links with the ICS_FAOSTAT codes: Map ASFIS - ICS - ISSCAAP data table
- the FAO ISSCFC and its links to the ICS_FAOSTAT codes: Map ISSCFC - ICS data table
- the latest version of the ASFIS list (2018), which also includes the links between species and ISSCAAP: fisheriesAsfis
The food composition factors being used for the fish and fishery products are provided in the Fishery Nutrient Factors data table. In each FBS the fish contribution to animal and total protein supply is indicated as a percentage.
For countries, currently the M49 coding is used: geographicAreaM49_fi dimension in the SWS.
Working system of FAO FIAS for the calculation of SUAs and FBS
Due to the close connection and interaction between species, products and elements, fishery food balance sheets need to be visualized in their completeness. Therefore the system is conceived countrywise, extracting one country at a time, with all its SUAs in product weight onscreen and having standardization into primary equivalent as its latest output.
The whole historical series is extracted, starting from 1961, as very frequent revisions occur either in data or in species identification and product classifications.
When updating a whole country, raw data for capture, aquaculture and commodities (production and trade), stored separately, have to be extracted, therefore the executable starts with:
interacting between the existing local databases to extract and merge data from different sources:
total fish production is first retrieved, manually, from the FishstatJ dataset “Global Production” (capture+aquaculture), already in aggregated form representing the 8 main groups and saved as a .csv file.
An executable picks up the .csv production file, then connects in real time to the commodities database, extracts all trade figures (quantities and values) and aggregates them by main groups of species and also according to their utilization type. In fact at raw data level, each one of the main groups may contain up to 11 product types, which are conceived according to the kind of processing and manufacturing they are subject to (fish can be fresh, frozen, filleted, cured, canned, prepared, reduced to meal and oils, etc. ).
The exec may also re-direct some commodities to another destination (i.e. from nei canned to pelagic canned) when controversies on species or product identification may have appeared or else to solve imbalances (this operation makes use of a linkage file duly filled during the years through an integrated procedure within the program).
Creation of a working spreadsheet in .csv/excel, with colored highlights on the cells presenting changes vs the existing database. The sheet can be modified, rows can be added or deleted and finally can be imported into the local extraction for balancing and analysis of final results of the updating.
Standardization to FBS
Once raw data are balanced, the final step is the conversion of each variable for each product type within each group of species into its corresponding live-weight equivalent, by making use of specific technical conversion factors.
In practice, the reason why every processed fish food commodity is reconverted into its primary equivalent is to obtain comparable statistics in homogeneous units applicable to all countries in the world.
The final output, FBS, available for dissemination is therefore represented by the series reconverted into their primary equivalent.
Some differences occur in the way standardization is carried out according to FIAS and FAOSTAT methodologies. This difference has always existed. It mainly consists in the way trade data are handled, taking into account both edible and inedible products (as in FAOSTAT) or only the edible component (as in FIAS). The final result of the total food fish supply and per capita food fish supply is practically identical
FIAS processed production in SWS: proposed workflow
Figure . represents the essential points of the overall workflow for processed production data.
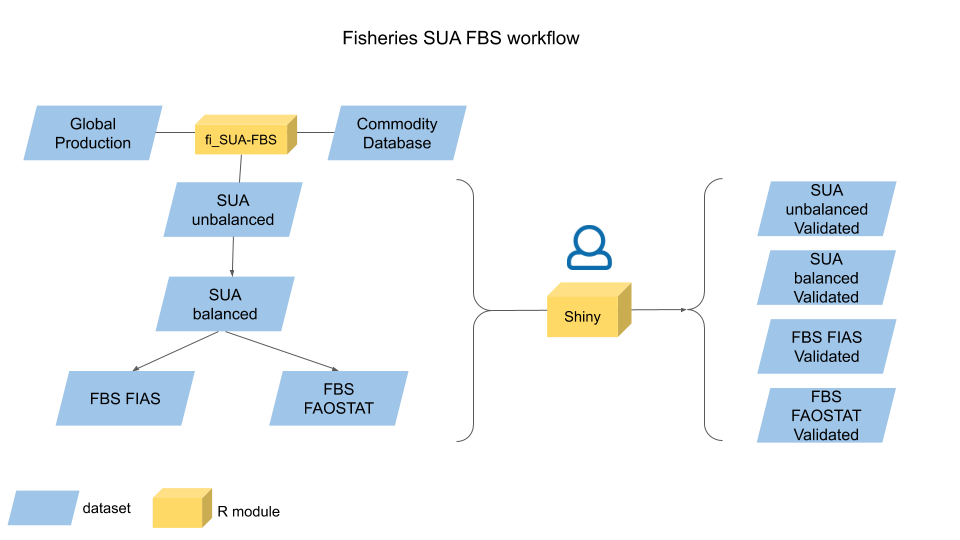
Figure .: General workflow for SUA/FBS compilation.
The first part of data collection and data entry is entirely performed by FIAS unit; the second part of data imputation and validation uses the ad-hoc Shiny application described in paragraph ??; the third part is an R-plugin to be run on the SWS.
SWS resources
SWS resources are R modules, data tables, data sets, and code lists. Data tables are typically used as auxiliary data to help R modules to achieve their goals, often a long-format four-to-six dimensional data set. The statistical domains in SWS, through code/reference lists, define the dimensions of the datasets. Therefore, datasets are primarily used to store code list - referenced values as either input and output in the SWS.
Because of the semi-standardized code list the questionnaire use to collect them, fishery processed production data are initially stored in data tables and migrated to a dataset only at the end of the process. The only dataset involved in the FIAS processed production is the Commodity dataset which has the dimensions listed in the description below.
Code lists
Code lists, also called reference lists in SWS parlance, are the dimensions making up the data sets that are designed by the user to store analytic results from SWS modules. Some dimensions are statistical-domain-specific and are defined by the technical unit to reflect its needs regarding data collection, processing, and dissemination while meeting FAO standards. Each data set dimension has a set of codes and their associated descriptions. Thus, code lists serve to the purpose of standardization, visualization, and metadata by associating standardized codes to standardized names in the SWS data set outputs. A typical SWS compliant data set has, therefore, the following dimensions/reference lists:
Geographic area. Representing a spatial scale the information is measured at. For example, countries, territories, regional aggregates, regional special groups aggregates, global aggregates. In SWS, the geographic area dimension used by FIAS data sets is named geographicAreaM49_fi. The dimension is specific for FIAS unit as it was initially decided and confirmed in a meeting held on April 10, 2019.
Items. These one want to take a measurement from. For example, commodities, commodity groups, land use types, species, etc. The FIAS - SWS framework item code/reference for SUAs and FBSs are named: fisheriesAsfis, measuredItemISSCFC, measuredItemFaostat_L2.
Elements. Often representing a measurement that can be taken across different items. For example, area, production, share. In SWS, the element dimension/code list used by FIAS dataset is named measuredElementSuaFbs.
Time (the time unit the data is displayed for: year, months, etc). In SWS, the time dimension used by FIAS data sets is named timePointYears.
Flag (A standardized label indicating origin and/or nature of a number in the data set, e.g.
(Official number)). In SWS, the flag dimension used by FIAS data sets is named flagObservationStatus. Please check the OCS statistical standards and the flags document to understand the flagObservationStatus rational and obtain the description of flags. Method (A standardized label indicating method utilized to obtain a number in the data set. In SWS, the method dimension used by FIAS data sets is named flagMethod. Please check the OCS statistical standards and the flags document to understand the flagMethod rational and obtain the description of flags.
Data tables
Data tables are mainly used to store information helping R modules to output analytic results. Information in data tables can be of a number of types. For example, conversion factors, arithmetic formulas, mapping between flags, mapping between international classifications, etc. Exceptionally, data are stored in data tables because of the initial code list used by the FIAS unit to collect data. In SWS hierarchy, all data tables reside in a given statistical domain. In the FIAS - SWS migration framework, the data tables are mainly in the Fisheries Commodities domain and only the nutrients table in the Fishery domain. Below is a list of current available and filled data tables used in the SUA-FBS calculation process.
Note: These data tables, especially those for mapping purposes, have to be regularly checked and updated inserting new links or new commodities or species codified.
- Mapping data tables:
Map ASFIS - ICS - ISSCAAP (SWS identifier:
map_asfis) maps species to the ICS and ISSCAAP group according to the YBKlang file.Map ICS FBS - ICS SUA (SWS identifier:
ics_l1_ics_l2) maps all the Faostat level 2 (ICS) products to the main Faostat group.Map ISSCFC - ICS (SWS identifier:
map_isscfc) maps all the commodities to the corresponding ICS product.
- SUA-FBS process instrumental data tables:
SUA-FBS: Balancing elements (SWS identifier:
balancing_elements) lists for each country the balancing element for each ICS product. This table is based on the SUAs provided as legacy from FIAS.SUA-FBS: Balancing problems (SWS identifier:
balancing_problems_tab) table where all the problems encountered with balancing are stored (negative balancing or unavailable quantities to cover input during the food processing element calculation)SUA-FBS: Commodity DB mapping (SWS identifier:
cdb_mapping) table to map single commodities to other ICS than the default one specified into the YBKlang file.SUA-FBS: conversion FBS elements (from old FIAS code) (SWS identifier:
oldfias2measuredelementfbs) table to import FIAS legacy FBS to convert FBS elements into SWS compatible codes.SUA-FBS: conversion FBS products (from old FIAS code) (SWS identifier:
oldfias2measureditemfbs) same as the previous table but with the FBS groups.SUA-FBS: conversion SUA elements (from old FIAS code) (SWS identifier:
oldfias2measuredelement) same as ‘oldfias2measuredelementfbs’ but for SUAs elements.SUA-FBS: element sign table (SWS identifier:
element_sign_table) table to assign the sign to all the elements in order to compute availability.SUA-FBS: FAOSTAT FBS element from SUA (SWS identifier:
fi_faostat_standardization_element) table to group SUA elements into FBS elements because sometimes SUAs elements are aggregated into one FBS element or the code is different.SUA-FBS: fbs_fias_tot2019 (SWS identifier:
fbs_fias_tot2019) since the dimension ‘measuredItemFaostat_L2’ does not contain a code for the total of all groups, the table stores these totals.SUA-FBS: Fisheries commodity tree (SWS identifier:
fi_commodity_tree) specifies the commodity tree for ICS product including both primary and secondary parents. The table also contains default extraction rates and the rank of ‘parenthood’ used for the food processing computation.SUA-FBS: Flag conversion (from old FIAS) (SWS identifier:
oldfias2flags) to convert old FIAS flags into SDMX flag system.SUA-FBS: Global Production mapping (SWS identifier:
gp_mapping) same as the ‘cd_mapping’ table but redirecting species into different ICS products.SUA-FBS: ICS product to FBS group (SWS identifier:
faostatl2_to_faostatl1) similar to the ‘ics_l1_2_ics_l2’ table but only including primary groups and Faostat major groups.SUA-FBS: Imbalances (SWS identifier:
imbalance_tab) where the imbalances involving secondary products are stored before increasing production so that the user can always check the initial imbalance and work on in differently from the simple production increase.SUA-FBS: Import deviations to other uses (SWS identifier:
other_uses) commodities allocated to other uses than the default one in the YBKlang file.SUA-FBS: importgeocodefias (SWS identifier:
importgeocodefias) table to import FIAS legacy file to link file names to M49 codes.SUA-FBS: Link table elements (SWS identifier:
link_table) table to deviate ICS products to other ones by flow (production, import, export) and specific periods.SUA-FBS: token (SWS identifier:
fi_sua_fbs_token) table where the token used by the shiny app are stored. This table get changes through the shiny app and has the tokens of the dataset sessions opened to run the plugin.SUA-FBS: token validated (SWS identifier:
fi_sua_fbs_token_val) table where the token used by the shiny app are stored. This table get changes through the shiny app and has the tokens of the validated dataset sessions opened to save the validated data.
Datasets
From the ‘Fishery’ SWS domain:
- Global Production (SWS identifier:
fi_global_production) contains all the production data for capture and aquaculture product by species and catching area.
From the ‘Fisheries Commodities’ SWS domain:
Commodities (total) (SWS identifier:
commodities_total) contains all the flows (production, import, export, re-export) of commodities by country and year.FBS fisheries - FAOSTAT standardized (SWS identifier:
fi_fbs_faostat) working dataset1 where FAOSTAT FBS are stored after the plugin completion.FBS fisheries - FAOSTAT standardized (Validated) (SWS identifier:
fi_fbs_faostat_validated) where FAOSTAT FBS data are saved after validation through the shiny app.FBS fisheries - FIAS standardized (1961-2017 legacy) (SWS identifier:
fi_fbs_fias_legacy) FIAS FBSs provided as legacy.FBS fisheries - FIAS standardized (Validated) (SWS identifier:
fi_fbs_fias_validated) where FIAS FBS data are saved after validation through the shiny app.FBS fisheries - FIAS standardized (SWS identifier:
fi_fbs_fias) working dataset2 where FIAS FBS are stored after the plugin completion.SUA balanced fisheries (1961-2017 legacy) (SWS identifier:
fi_sua_balanced_legacy) FIAS SUAs provided as legacy.SUA balanced fisheries (Validated) (SWS identifier:
fi_sua_balanced_validated) where SUA balanced data are saved after validation through the shiny app.SUA balanced fisheries (SWS identifier:
fi_sua_validated) working dataset3 where SUA balanced are stored after the plugin completion.SUA unbalanced fisheries (Validated) (SWS identifier:
fi_sua_unbalanced_validated) where SUA unbalanced data are saved after validation through the shiny app.SUA unbalanced fisheries (SWS identifier:
fi_sua_unbalanced) working dataset4 where SUA unbalanced are stored after the plugin completion.
Definition and conversion of SUA-FBS Elements
The integration of the statistical processes to produce the Supply Utilization Accounts (SUAs) and Food Balance Sheets (FBSs) for the Fisheries and Aquaculture Statistics and Information Branch (FIAS) into the Statistical Working System (SWS) requires the harmonization of Element codes currently used by FIAS. The new codes are already in use in the SWS for producing the SUA/FBS of crops and livestock food items and are consistent with FAOSTAT. The conversion tables proposed in this document aim to reflect the current variables and their codes in use by FIAS with no or minimum discrepancy. Nevertheless, the conversion also seeks consistency with other domains. Consistency helps to integrate the same elements from separate domains and simplifies the standardization needed to produce the FBSs including fish products. Proposed changes mainly concern units of measure and labels.
List of the SUA elements used by FIAS:
| Code | Description | Unit of measure |
|---|---|---|
| 031 | Input | Tonnes |
| 041 | Extraction rate | hg/tonnes (Prod in hg / Input in tonnes) |
| 051 | Production (or Output) | Tonnes |
| 061 | Imports – Qty | Tonnes |
| 062 | Imports – Val 1000 | US Dollars |
| 063 | Import Unit Value | US Dollars/tonnes |
| 066 | Standardized Imports | Not in use as only FBSs contain standardized quantities |
| 071 | Stock Variation | Tonnes |
| 077 | Cumulative Stocks | Tonnes |
| 091 | Exports – Qty | Tonnes |
| 092 | Exports – Val | 1000 US Dollars |
| 093 | Export Unit Value | US Dollars/tonnes |
| 096 | Standardized Exports | Not in use as only FBSs contain standardized quantities |
| 101 | Feed | Tonnes |
| 111 | Baiting | Tonnes |
| 121 | Waste | Tonnes |
| 131 | Processing | Tonnes |
| 141 | Food | Tonnes |
| 151 | Other Utilizations | Tonnes |
| 181 | Statistical Discrepancy | Tonnes |
| 261 | Food: Total Calories Eqv | Kcal |
| 264 | Calories/Caput/Day | Kcal/caput/day |
| 271 | Food: Total Proteins Eqv | Grams |
| 274 | Proteins/Caput/Day | Grams |
| 281 | Food: Total Fats Eqv | Grams |
| 284 | Fats/Caput/Day | Grams |
SUA element conversion
Figure . summarizes the conversion from FIAS codes into the Statistical Working System codes.
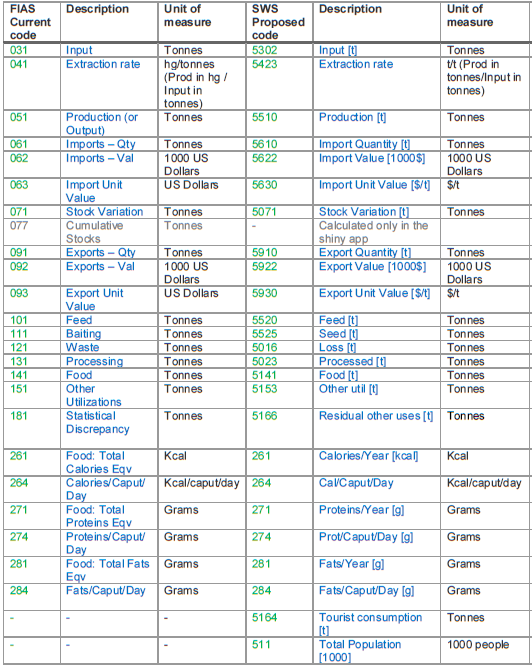
Figure .: Conversion from FIAS to SWS codes for SUA elements.
Major changes from the old to the new classification are listed below: 1. Baiting. The code in use for ‘baiting’, 111, corresponds to code 5525 associated to the term ‘seed’. Since the concept of bait in fishery is similar to the one of seed in agriculture, the proposed code is seed (5525). 2. Standardized import and export. The code is already not in use as quantity standardization only takes place when producing the FBSs, not in the SUA calculation. 3. Cumulative stocks. This element is not converted into the new system for two main reasons: (i) no corresponding element is currently included in the element list in SWS (ii) code is only used for checking purposes Therefore, the cumulative stock are only displayed into the shiny application to allow for checks.
4. Statistical discrepancy. The code relates to imbalances observed at SUA level. For organizational consistency purposes the code appears both in SUAs and FBSs but only actually applies to SUAs. The code does not apply to Fishery FBSs as Fishery department only publishes balanced data. 5. Tourist consumption and population. These two codes will be included into the SUAs for possible further developments.
FIAS standardized FBS element conversion
According to FIAS methodology, the standardization process from the SUAs to the FBSs has the structure presented in figure .. The first two columns report the code and the description of the most suitable code in the SWS for the FBS element contained in FIAS documentation. The name of the element used in FIAS document is reported in the column ‘Description Doc’. The SUA elements corresponding to the FBS ones before standardization are in the columns ‘SUA codes (SWS)’ and ‘Description (SWS)’.
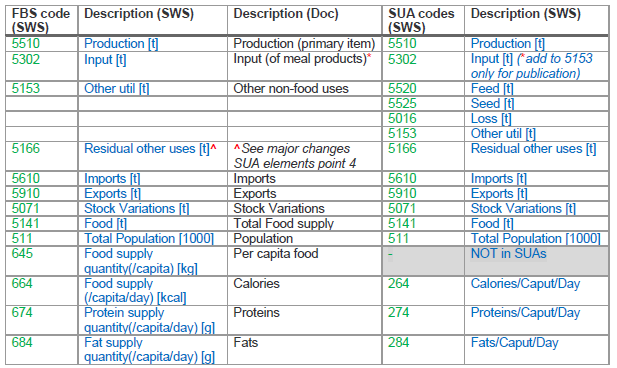
Figure .: FBS elements according to FIAS standardization with corresponding SUA codes.
A brief description of the FBS elements as provided by FIAS:
Production: Production figures relate to the total national fish production in terms of live-weight (i.e. the actual ex-water weight at the time of capture or removal from aquatic environment). Production figures cover capture and aquaculture data of all fish, crustaceans, molluscs and aquatic organisms, excluding mammals and aquatic plants.
Other uses: Includes reduction to fish meal and fish oil; utilization of aquatic products for feed and bait; ornamental purposes; withdrawals from markets; and any other non-food use of fishery production. Waste is not included.
Imports: This covers all movements of commercial trade into the country of fish and fish products. Data on imports include fish caught by foreign fishing vessels and landed in domestic ports. A difference occurs in the way imports (as exports) data are recorded for the FBS of fish and fish products disseminated by FIAS and the ones disseminated by Faostat.
Exports: This covers all movements out of the country of fish and fish products. Data on exports include re-exports and fish caught by domestic fishing vessels and landed directly in foreign ports.
Stock variations: This category refers to changes in stocks occurring at all levels between the production and the retail levels. It covers changes in government stocks, in stocks with manufacturers, importers, exporters, other wholesale and retail merchants, transport and storage enterprises. Information on changes in stocks is often not available or incomplete for a number of countries and important commodities. In many instances data refer to the minimum information required to avoid a negative balance.
Total Food Fish Supply: There are various ways of defining “supply” and, in fact, various concepts are in use. The elements involved are production, imports, exports and changes in stocks (increases or decreases). There is no doubt that production, imports and decreases in stocks are genuine supply elements. Exports and increases in stocks might, however, be considered as utilization elements. Accordingly, the following is the way of calculating “supply” according to FAO methodology:
Production (excluding non-food uses) + Imports - Exports + or - Changes in stocks = Total supply for human consumption
Population: Refers to the present-in-area population, i.e. includes all persons physically present within the geographical boundaries of countries. In general, the population data used are mid-year estimates published for each country by the Population Division of the UN.
Per Capita Supply: Data under this category indicate the per capita food-fish supplies available for human consumption during a given reference period. It is derived by dividing the Total Food Supply by the Population.
Live weight: The weight of finfish and shellfish at the time of their capture or harvest. Calculated on the basis of conversion factors from landed to nominal weight and on rates prevailing among national industries for each type of processing.
Faostat standardized FBS element conversion
Figure . summarizes the conversion from FIAS codes into the Statistical Working System codes according to the Faostat standardization.
Since figures in the SWS have Tonnes (t) as unit of measure, whereas in Faostat they are in Thousands of Tonnes (1000 t), figure . reports first the Faostat code and description as reported in the website (first and second columns); the third and fourth columns report the code and labels of the FBS elements in use in the SWS and the fifth and sixth columns refer to the SUA elements.
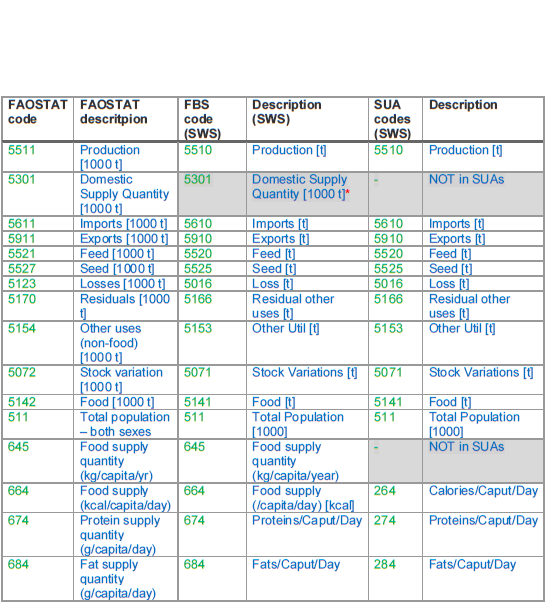
Figure .: FAOSTAT FBS, SWS FBS and SUA element correspondence table. Note in the SWS to avoid disruption with the unit of measure of the other elements.
Flag conversion
Transitioning from the current FIAS system to the SWS also the flag system is being updated. The proposed conversion is:
| FLAG description | Current FIAS flag | FlagObservationStatus | FlagMethod |
|---|---|---|---|
| Official data | ‘’ | ‘’ | ‘-’ |
| Expert estimate | ‘E’ | ‘E’ | ‘f’ |
| Calculated value | ‘C’ | ‘I’ | ‘i’ |
| Balancing element | ‘B’ | ‘E’ | ‘b’ |
| Provisional value (carry-forward) | ‘T’ | ‘E’ | ‘t’ |
Respectively the FlagObservationStatus and the FlagMethod are defined by the SDMX standard as: - FlagObservationStatus: for dissemination. Definition: Information on the quality of a value or an unusual or missing value. This item is normally coded and uses codes providing information about the status of a value, with respect to events such as “break”, “estimated value”, “forecast”, “missing value”, or “provisional value”. - FlagMethod: this list of methods flags is to be used by IT specialists in statistical working systems only (Statistical Working System -SWS- and others). It does not concern dissemination. It relates to the method the figure comes from.
Note no data needs (can be but don’t have to) to be saved here, final data will be saved into the validated dataset.↩
Note no data needs (can be but don’t have to) to be saved here, final data will be saved into the validated dataset.↩
Note no data needs (can be but don’t have to) to be saved here, final data will be saved into the validated dataset.↩
Note no data needs (can be but don’t have to) to be saved here, final data will be saved into the validated dataset.↩